Twitter Analytics: Stats for your tweets

Setting up your website is step one, promoting it is step two. The basis of that should be great content, and social media is your handy, free platform for this (next to all the great links you have gathered for your site, of course).
If you want to learn more about using social media and other essential SEO skills, you should check out our All-Around SEO training! It doesn’t just tell you about SEO: it’ll help you put these skills into practice!
Social media, for us, is focused on Facebook, Pinterest, Instagram, YouTube and Twitter. Over the next couple of weeks, I’ll guide through the analytics of these platforms. Thijs already wrote about setting up a strategy and picking an audience, these next posts will focus on what stats and extra information these platforms themselves provide. Much like the Webmaster Tools series we did last year. This post is about Twitter Analytics.

Tip: open your Twitter Analytics so we can guide you through the most useful stats!
Twitter Analytics dashboard
You can find your Twitter Analytics dashboard at analytics.twitter.com. It starts with a summary of the last 28 days:
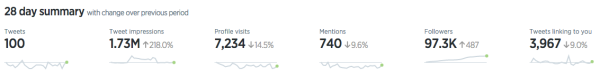
How does this help? The large numbers are nice, but what really is helpful is the percentage next to these numbers. How did your numbers change compared to the previous 28 days. Audience (‘tweet impressions’) went up a lot in this case, which might have been triggered by the start of our Yoast Academy’s Basic SEO Training. Looking at profile visits, the drop isn’t that important to analyze, as personally, I could not care less, and more important, the numbers of followers shows a steadily increasing number, also indicated by the small graph below the numbers.
The 28 day summary is a quick overview, and the trend is more important than the numbers.
This month in Twitter Analytics
I like the second section a lot more. Twitter Analytics shows all kind of details about your tweets and following. Here’s what Twitter Analytics tells us about last month:
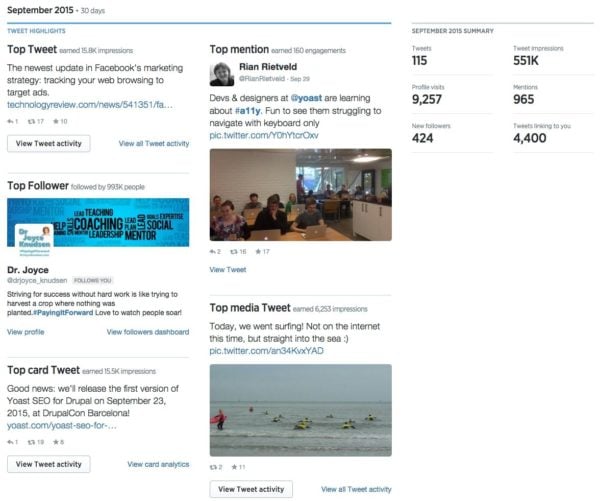
Now I have to be honest: this dashboard is a nice magazine-style summary of incidences. This tells me just about nothing. It’s what’s beneath all these instances what matters. Every section in that screenshot has a ‘View [something]’ link to all the good stuff.
Tweet activity
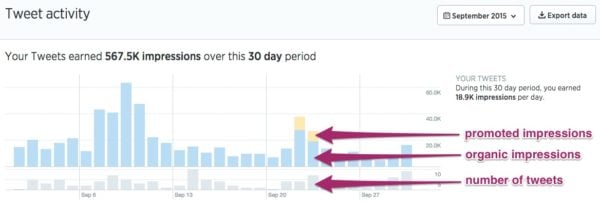
The ‘View all Tweet activity’ link in Twitter Analytics brings you to a nice overview per period. You can see the number of tweets per day, and the impressions:
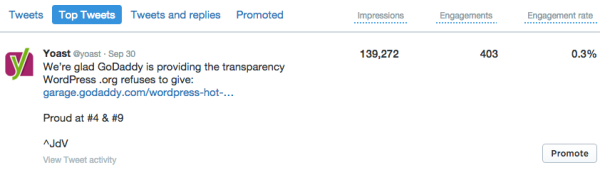
Right below that graph, you’ll find details per tweet, like your most engaging tweet:
If you’re goal is to build your audience, ‘Tweets & replies’ gives you a nice overview of what happens in terms of replies and favorites. Clicking the tweet itself gives you some more information as well:
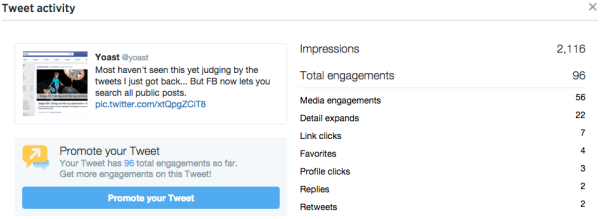
I think the ‘Detail expands’ is an interesting number. Probably depending on the Twitter client, right. And should we call that engagement already?
‘Favorites’ is another number that has become fuzzy for me over the past year or so, as I know quite a few people that use the Twitter favorite option to trigger IFTTT scripts to add the tweet to Buffer for sharing it on their own timeline as well. I might just made that number even fuzzier, if I have given you an idea :)
Audience Insights
Although I think ‘Audiences’ is a very interesting section, it has a basis in how much Twitter knows about all of us. You might question the figures here, obviously. But when our Audience insights in Twitter Analytics shows me this overview below, I think they know quite a bit about us all:
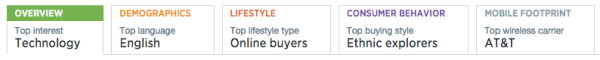
Our followers are mostly interested in Technology, communicate in English, are Online buyers and Ethnic explorers. OK, that last one confused me a bit. Apparently, these are people that have a wide range of international foods on their shopping lists. I’m glad Twitter provides handy mouse-overs:
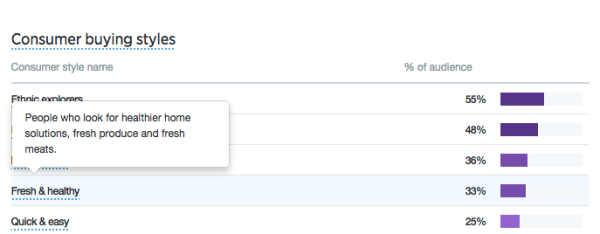
Not sure I’m glad they used this kind of segmentation, as that tells me little about our business.
You can also see what percentage is male of female, household income, net worth and if people are married. If and what education they have, and if they are home owners or not. Not sure how reliable these figures are, as mentioned.
There is also a list of wireless carriers on this tab – anyone using that list for any purpose? That one seems to be added for the sole reason that this data was available. I think Twitter is a bit off with this one. All the rest on this page is related to the audience, carrier is related to technology, IMHO.
This one seems tricky as well: on the ‘Lifestyle’ tab, Twitter Analytics tells me the political party affiliation. I wouldn’t base my tweets on that graph. I am sure there is a nice complicated algorithm calculating this, but it seems hard to be spot on with this one. Again, it might help you find a trend in this, though.
Twitter ups its game on the ‘Customer behavior’ tab: it shows the number of VISA and MasterCard users, Aftermarket auto buyer types, and even what percentage of your followers buys cheese. Infotainment? It feels like this is it.
However, there is an interesting bit of information hidden on the ‘Mobile footprint’ tab:
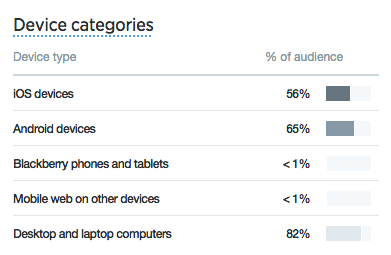
If you are linking your site’s articles on your Twitter timeline, this is actually valuable information. And I understand that this information can be obtained easily. If the majority of your Twitter visitors is using Android devices, and these click to your website from Twitter, test your website on Android. A responsive website should take care of this, obviously.
Card Analytics
I saved this one for last. Following my post on optimizing product pages using Open Graph and Twitter Cards, this section is all about that last one.
Twitter actually provides nice insights on how your cards are doing:
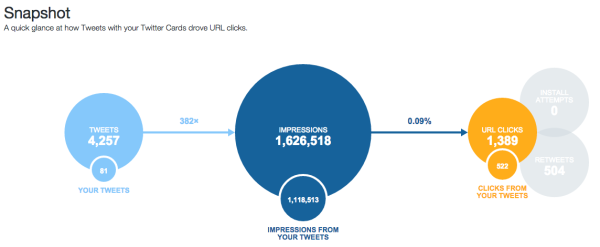
That’s just a quick overview. The rest of the page is even more interesting:
- There is a trend graph to indicate how much Twitter Cards affected impression and clicks. Twitter Cards make all the difference. Just check your own stats and see. To me, it means investing in things like illustrations or great photography for your posts and thus tweets pays off. There is a reason we hired an additional illustrator recently. That also goes for Facebook, by the way. We see a lot more engagement on posts that have illustrations compared to those that don’t.
- Twitter Analytics also shows what type of card works best for improving clicks. Twitter Analytics compared ‘everyone’s cards’ to ‘your cards’. The Player Card seems to perform best for everyone. Number two and three are summary cards (with or without image). These can both be added to your website using Yoast SEO for WordPress. Be sure to add these cards.
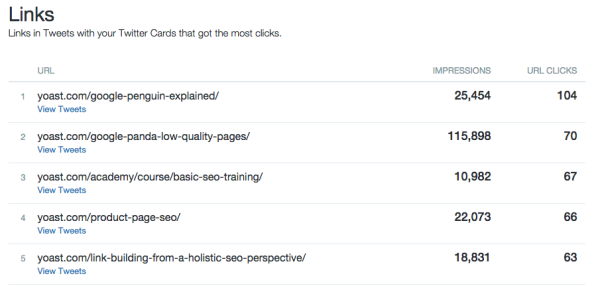
- There is a nice overview of the links that performed best:
- There is an influencers overview. As Twitter puts it: “Find out which accounts are already impacting traffic to your website and start a conversation with them.” Cindy, Neil and Michael, thanks for tweeting / replying / mentioning us. Appreciated.
- New wine in old bags. If one of your tweets performs above average, you might consider retweeting them. Twitter shows you a nice overview of the tweets that drove the most clicks.
- Finally, and perhaps oddly, we find an overview of the sources our influencers used to send tweets. Loads of you are using Hootsuite (we are for team collaboration, by the way), and too little are using Tweetbot (which I use personally). Both also come with their own overview of twitter analytics.
Note that all the data that is available for URL clicks, is also available for your retweets. Talking about Twitter Cards, the Photo Card seems to help retweets as well, for instance.
Be sure to check regularly
I think this article covers Twitter Analytics for now. Be sure to check these stats regularly and see what changes. See what tweets perform best and if you are still roughly reaching the audience you are looking for. Social media like Twitter and Facebook are getting more and more intelligent and I expect data to be become more valid and trustworthy in a fast pace.
As always, be sure to drop your two cents in the comments below. Let me know if I missed anything, our readers will thank you for even more insights!
You might also want to read:
This is interesting. Any feedback yet?