Users Flow in Google Analytics

Don’t you ever just wonder which pages people look at after they land on your site? How do people click through your website? How do they navigate? Questions like these can be answered with the use of Google Analytics. In this post, I want to show you a very cool feature called: Users Flow.
What is a Users Flow?
Google Analytics is known for sharing loads and loads of data. In reports and in graphs. But there are some places in Google Analytics where you can find a visualization of data! Exciting! Users Flow is one of them. Let’s check Google’s definition of a Users Flow:
The Users Flow report is a graphical representation of the paths users took through your site, from the source, through the various pages, and where along their paths they exited your site.
And here’s how it looks:
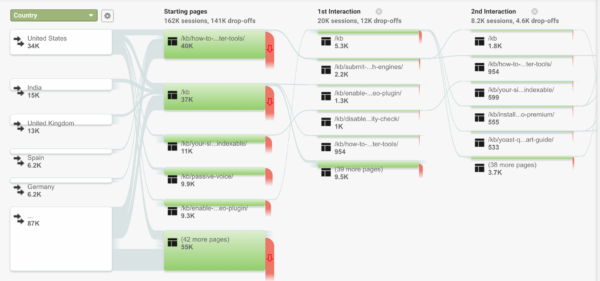
You can find the Users Flow in the Audience section when you scroll all the way down. Now, by default the starting point of the User Flow is Country. And if this demographic is important for your business, this is an interesting report. You can analyze if people from other countries have different navigation styles. Something to take into account if you have a multilingual site, for instance.
You can see the starting page, the first interaction, second and so on. The green is the number of sessions on that page, and the red is the number of drop-offs. Please note that it shows relative numbers, not absolute numbers.
The User Flow has some awesome options:
- Selection a dimension of your choosing;
- Adding a segment;
- Highlighting traffic from a specific segment.
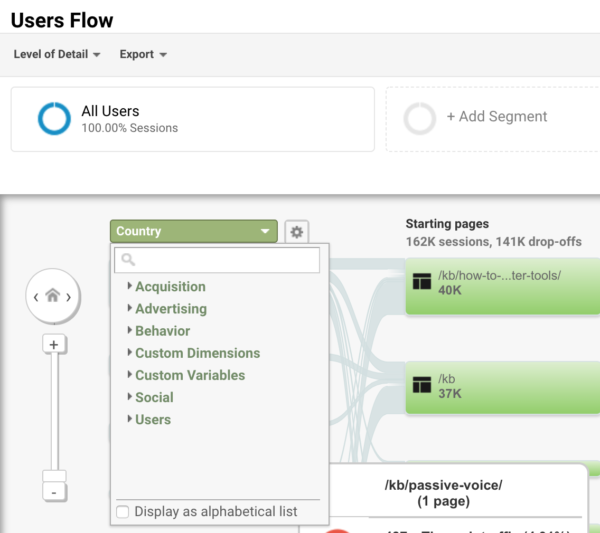
Dimensions in Users Flows
You can imagine that the reason people visit your site can differ, it can differ per source, per campaign and so on. You can analyze the intent people have with Users Flows. For instance, you can expect people that come from an organic search to have an informational search intent; they’re looking for information. People coming from social, perhaps they’re looking for amusement. And people coming from a campaign you’re running, you probably want them to convert. You can select a lot of dimensions in the Users Flow, allowing you to analyze traffic from different sources, landing pages and so on.
What does the chart tell you? Do they behave like you expect/want them to behave? And if not, ask yourself how you can optimize their flow. Before you look at the chart, think about how you want them to behave first.
Adding a segment
Not only is it interesting to check how people behave from different sources and so on, but it’s also interesting if you can specify that group of people. For instance, analyzing the behavior of New visitors and then analyzing the behavior of Returning visitors.
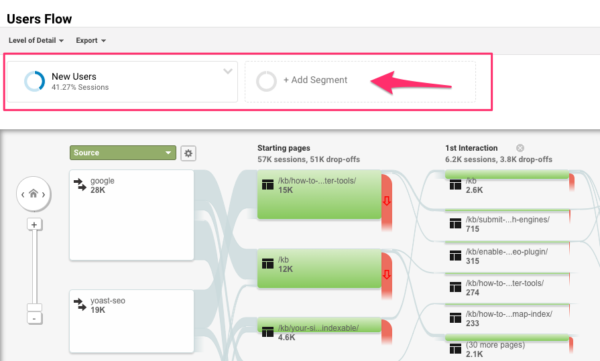
You can also compare the visitors that converted with visitors that didn’t convert. Analyze their paths and map out the navigation. Perhaps you can optimize your navigation options?
You can think of a lot of options to analyze here; you can look at whatever you want! So think about what kind of questions you want answered before diving into all the juicy details :-)
Highlighting traffic
The Users Flow is a lot to take in. And for the ease of your own eyes, viewing just one flow can be helpful, it’ll probably help you with analyzing as well.
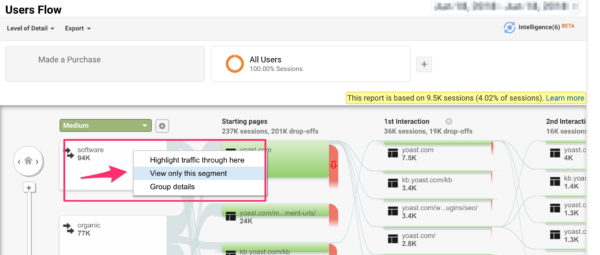
You can click on every item to view the segment only or to highlight traffic. Last but not least, you can export the Users Flow to a PDF file so you can share it with someone you think will find it interesting.
Conclusion
Using User Flows will help you understand how people navigate through your website and gives you information on how to improve your navigation. It’ll give you insights into how effective your sources and pages are. It’ll show you where people drop-off. And by specifying the Users Flow further, you can see if some sources or campaigns are more effective than others. Of course, place the information in your own context. Check what the goal is of the source of campaign or what you’d like to investigate before you draw conclusions.
Read more: Assisted conversation in Google Analytics »

Great article on this feature of Google Analytics, I was unfamiliar with this feature and you explained it in a very helpful manner. Will be taking this back to share with my fellow SEO colleagues.
Thanks for sharing the article. It was of much help to me and my team.
Can you explain the difference between “relative” numbers and “actual” numbers please?
Thanks for the question Carolyn. Looking at it again made me realize I meant “absolute” numbers instead of “actual” numbers.
Absolute numbers is the real-life number, the exact number. Like how much users you’ve gotten on day X.
Relative numbers is a bit harder to explain. A relative number isn’t the exact number. It’s a number that depends on another number. It’s relative to another number. So 15k sessions is 15k of 57k sessions. But it’s not the exact number of sessions. You must see it more as in comparison with.
Hope this makes it more clear :-)
good question, following
Thanks for sharing this important article. Google Analytics is a very powerful. I feel content writer should spend more times on tools like Google Analytics than churning out articles just like I was doing on my blog.