What are dimensions and metrics in Google Analytics?

Anyone who has browsed through Google Analytics should have come across a whole lot of variables in the reporting stats. The reports consist of dimensions and metrics; Google Analytics calls these the building blocks of your reports. And if you want to create a custom report in Google Analytics or Google Data Studio, you have complete freedom in what dimensions and metrics you put in this report. But be careful, you might create a useless report. In this post, I’m going to explain what the difference is between dimensions and metrics. And what to look out for when combining these two yourselves.
Google is replacing the current Universal Analytics with Google Analytics 4 in 2023. Check out our post about how to prepare for Google Analytics 4
What are dimensions in Google Analytics?
All the data you see in Google Analytics, all variables in reports is either a dimension or a metric. Google explains dimensions as:
Dimensions are attributes of your data.
So in a way, a dimension is a description, a characteristic, a feature or aspect of your data. It’s not a quantitative variable but more a qualitative variable. Let me make this clear by giving you a couple of examples of metrics:
- City
- Device
- Source/Medium
- Campaign
- Page
- Goals
- Products
Notice what they all have in common? They all consist of words, not numbers. Of course, some dimensions are expressed in numbers, like hour and date. But still, the dimension is an aspect or feature of the user itself, but not how or what the user is doing on your site. Dimensions describe the data that’s collected.
You can see dimensions in the first column of your reports.
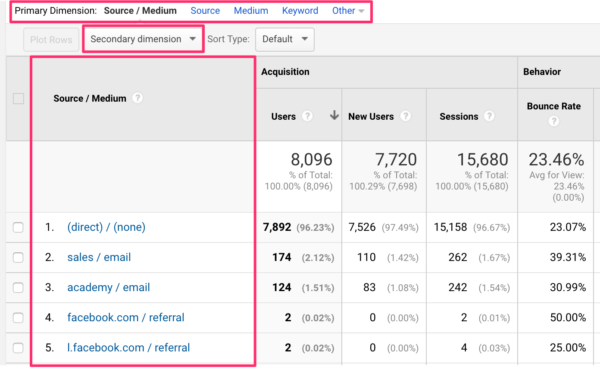
The report also gives you clues on what other dimensions there are and there are sooooo many. If you’re curious on what other dimensions you can add to, in this example, the Acquisition: Source/Medium report, click on the Secondary dimension button.
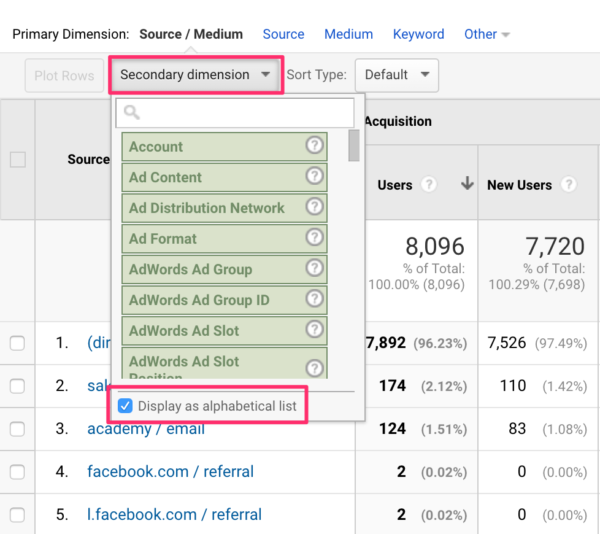
When you click on ‘Display as alphabetical list’ you can browse through all dimensions you can add to this particular report. It’s an easy way for you to get familiar with dimensions.
For instance, you can add ‘User Type’ as a secondary dimension, to see which source drives more New visitors to your site. You can add ‘Page’ to your report, to check which pages people land on from a particular source. You can do a lot of cool things here, and quite easily as well. But before you go all out; what’s the question you’re trying to answer?
What are metrics in Google Analytics?
Metrics are the numbers you see in each dimension. Metrics show you what a user did on your site, expressed in numbers. For example, if we look at the Behavior – All Pages report:
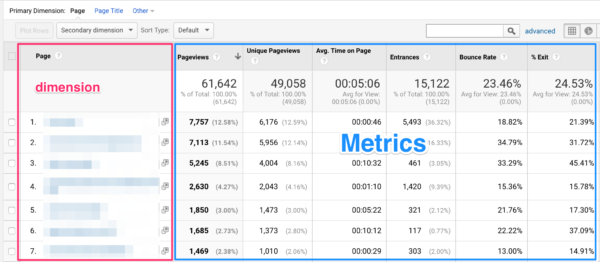
The page is the dimension; it’s the variable in which specific metrics are collected. Pageviews and entrances and such are metrics; these variables show you numbers on what users did in this particular dimension.
Metrics need dimensions, for context, otherwise, it’s just numbers.
The standard Google Analytics doesn’t allow you to add a secondary metric, because not every metric is collected for every dimension. It might raise your eyebrows, and it’s a bit confusing. But it gets less complicated if you know how Google Analytics collects data.
What’s scope in Google Analytics?
Ever wondered why Google Analytics shows certain dimensions and metrics but leaves out other seemingly essential dimensions and metrics in their default reports? That’s because Google Analytics doesn’t want to combine these two, it would show incorrect data and will let you draw conclusions based on the wrong data. Now, why is that? Why does Google Analytics want to prevent you from combining this? It all has to do with how Google Analytics processes its data: Google Analytics scope. Each dimension and metric can only have one of the following scope-types:
- Hit
- Session
- User
- Product
Hit
You can see a hit as everytime a user (cookie) does something on your site, it will send data to Google Analytics. Every single action is stored. The hit scope is the lowest level of data storage. A page is a hit-level dimension, just like language and page title is. Pageviews, time on page, load time and total events are examples of metrics on hit-level.
Session
The session scope is more time-based and is one level higher than the hit-level. A session consists of hits that happen in just one session for the same user. Dimensions and metrics on session-level collect data about a session. Examples of dimensions on a session-level are Source/Medium, Landing Page, and Device Category. Examples of session-level metrics are sessions, bounce rate, exits, goals, and pageviews per session.
User
The user scope is the highest level in which data is organized. Users can have more sessions, and a session can have more hits. Examples of dimensions that belong to the user scope are user type, days since the last session, gender. Examples of user-level metrics are users, new sessions, and percentage of new sessions.
Product
The product-level scope has everything to do with data about a product.
Combining dimensions and metrics: do’s and don’ts
The session-level dimensions and metrics contain data about specific sessions. But hit-level dimensions and metrics don’t have data on session-level variables because they’re independent of sessions. So if you decide to combine pages with sessions in a custom report because you want to see how many sessions a page has gotten during a session, you’d be looking at something else than what you were expecting.
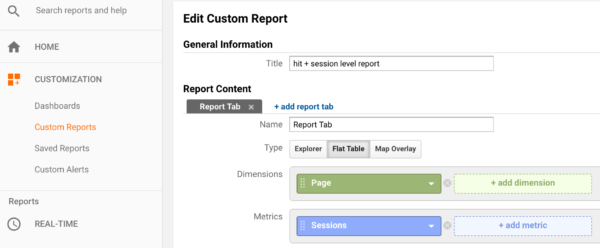
This report will show you something like this:
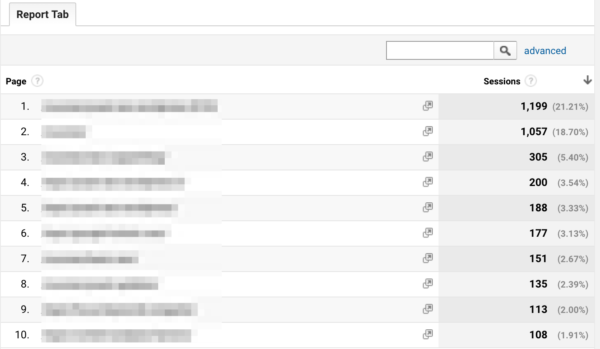
But if you think that page 1 was viewed in 1,199 sessions in total, then you’re wrong. What you are seeing is how many sessions began on page 1. because that’s the first hit of the session. There are a couple of common reporting fails described by LunaMetrics that explains this in more detail.
We just learned that you couldn’t combine dimensions and metrics that don’t share the same scope. Best practice is obviously to check whether or not the dimensions and metrics you want to combine, do share the same scope. But how can you find out? Google has a Dimensions and Metrics Explorer. On this page, you can find all dimensions and metrics. When I first saw this huge list and expanded a couple of items, I got confused. I couldn’t make sense of it.
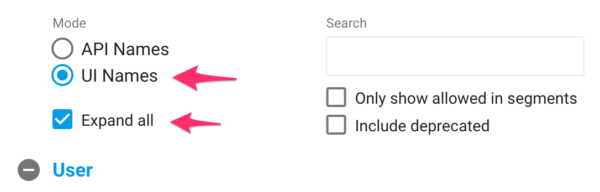
But it helps if you use the UI Names, the names that you see in Google Analytics itself. And by expanding them all, you’ll have a nice overview. Don’t click on the dimension or metric, instead click on the checkbox. Some will turn to grey if you do that, then you’ll know you can’t use these in combination. Still, if you select ‘pageviews’, the ‘sessions’ metric doesn’t turn grey. And the list doesn’t show you on which scope every dimension or metric is processed. So this tool isn’t foolproof when it comes down to combining your dimensions and metrics in a custom report. Unfortunately, defining which scope it is, is something you have to do yourself.
Conclusion
When creating custom reports, segments or you’re going more advanced with custom dimensions and custom metrics, think about what you want to measure first. Think about on what level, or scope your dimensions and metrics are. And think about if it all makes sense. In general, if you want to add the Sessions metric to a custom report, make sure you stick to the Session-level scope! And don’t combine hit-level variables with session-level variables.
Read more: How to guide: Tracking your SEO with Google Analytics »

Very well written, refining repoer using secondary dimension section was very useful.
Is the Yoast SEO Premium for the beginners also?
Hi Ahmed! Yes, it has a lot of extra features that can help you, you can read more about those here: https://yoast.com/yoast-seo-premium-features/. We have also just released a new, free SEO course for beginners so that might be the thing for you! You can find it here: https://yoast.com/academy/course/free-seo-course-seo-for-beginners/. Hope that helps! :)
You’ve said it all, really “Mind Blowing” am so addicted to All yoast products.
“YOAST” thanks for making the seo world much easier.
Yes. All Yoast products are truly brilliant but Yoast SEO Woocommerce Plugin is truly helping me in one of my Ecommerce website.
The information is very clear. Explanation on how to use google analytics effectively for tracking and improving your website traffic is really good and surely will help a lot.
This post is helpful. I am relatively new to Yoast SEO Premium and am happy with it so far…