Create your first report in Google Data Studio

When working with Google Analytics, you do not always want to stick with just a secondary dimension. Sometimes, you also want a third and fourth dimension. But in Google Analytics’s standard reports, that’s not possible. And the custom reports you can create in Google Analytics are very satisfying to look at. Maybe it’s my perfectionism talking, maybe not. But if I want to create a report, I want it to look nice. Luckily, there’s this tool called Google Data Studio. And oh my, I love it!
What’s Google Data Studio?
If I’d had to explain what it is: Google Data Studio is a tool in which you can visualize your data. You can connect all types of data to Google Data Studio, like Google Sheets, you can upload CSV files and…..drumroll Google Analytics! And it connects really really easy with Google Analytics.
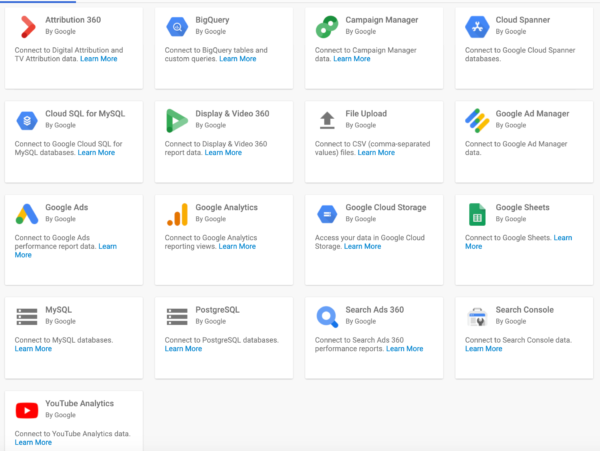
You can create all sorts of reports with nice graphs, charts, and tables, bringing your data to life. I’m not thoroughly going to cover every aspect of Google Data Studio, you can use Google for that. But my goal for this post is that you’re going to give Google Data Studio a try and create a nice report with more than two dimensions!
Connect Google Analytics to Google Data Studio
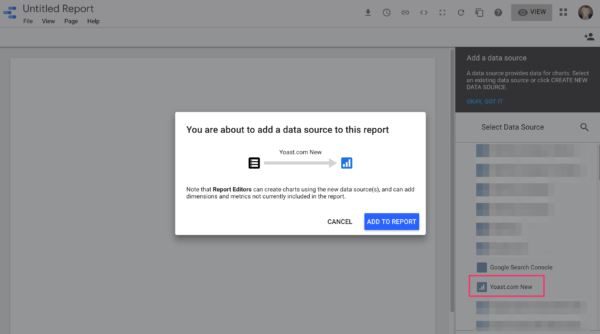
In order to get Google Analytics data in Google Data Studio, you need to make a connection between the two. The only requirement is that you have a Google Analytics account and a Google Data Studio account. Since they’re both Google products, this connection is easy to set up. And therefore shouldn’t hold you back from trying Google Data Studio. The steps are explained in this post about connecting your Google Analytics account.
Recreate the Source/Medium report in Google Data Studio
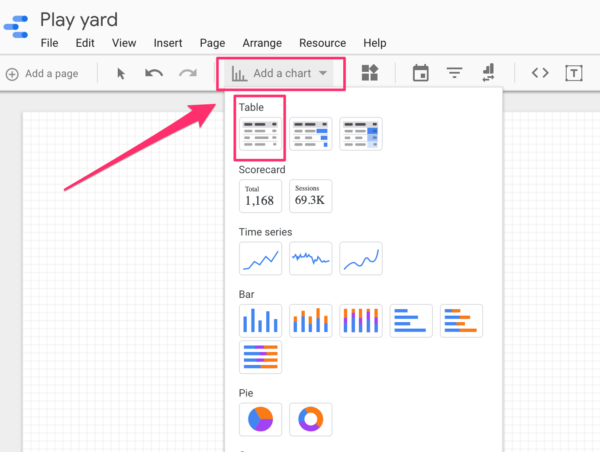
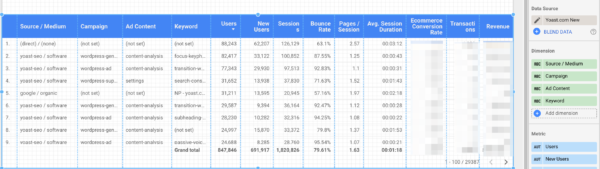
When I first tried Google Data Studio, I was surprised how intuitively this tool was. The first thing I did to get more familiar with the data tool was to recreate one of my favorite reports in Google Analytics: the Source / Medium report. You start with adding a chart, in this case, a table.
It automatically adds Source and Sessions. Cool thing is that the distinction between dimensions and metrics is immediately visible. The dimensions are green, the metrics are blue. It’s very cool to see the wide range of dimensions and metrics Google Analytics has to offer.
If you click on ‘Source’ you can replace that dimension by scrolling through the dimensions or if you already know the name of the dimension, by typing the name in the search field. The same goes for metrics. To recreate the Source / Medium report, we need to add a couple of metrics.
- Dimension: Source / Medium
- Metric: Users
- Metric: New users
- Metric: Sessions
- Metric: Bounce Rate
- Metric: Pages / Session
- Metric: Avg. Session Duration
- Metric: Goal Conversion Rate (or Ecommerce Conversion Rate)
- Metric: Goal completions (or Transactions)
- Metric: Goal value (or Revenue)
Since we have an online shop, I’m adding the Ecommerce metrics to my report:
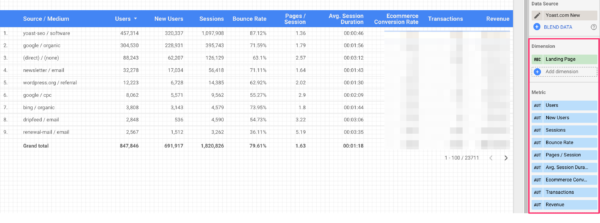
And there you go! You’ve just recreated the Source / Medium report in Google Data Studio. And this is exciting already of course because you just witnessed for yourself how easy it can be. But now, we’re going to add some cool to this report.
Customize that report
If you use UTM tagging and use campaign, content and term tags, you can add all of these in a report! Give it a try. Your first reaction might be that it would be awesome to have all that information in one table. But you’ll quickly see that your report becomes too cluttered and obscure.
If you want data to speak for itself then reports must be readable. So adding a lot of dimensions to your reports is not something you want. Think about on what levels you want to see your data. If you want to see just your traffic from search engines there’s no need to see data from other traffic sources right?
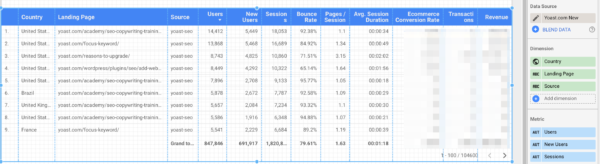
In which cases would you like to see more than two dimensions? I love the combination of Source and Landing page. And even more so the combination of Source, Landing page and Campaign to check how my marketing campaigns are doing. Other dimensions that are insightful is Device category, Source and Landing page. Or Region, Source and Landing page. Or if you’re more international, like us, Country, Source and Landing page.
Add some fun
Google Data Studio offers filters that easily allow you to specify your data even further. And I’m a fan of specifying your data because it gives you so much more context. You can add Source as a filter, Medium, Campaign, Country, you name it, you can filter it. Make sure it makes sense though. For me, this is such an awesome feature of Google Data Studio!
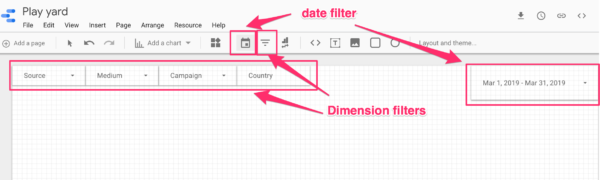
You can also add a date range filter, which allows you to adjust the date range to your own likings. This makes sure that your dashboard isn’t just a one-time thing, but a dynamic dashboard you can use at all times.
The first thing I always do when I create a report is adding the date range filter. And I really sit down and think about what kind of filters I want. I sometimes even draw out the report I’d like to see by hand on a piece of paper and then create it in Google Data Studio.
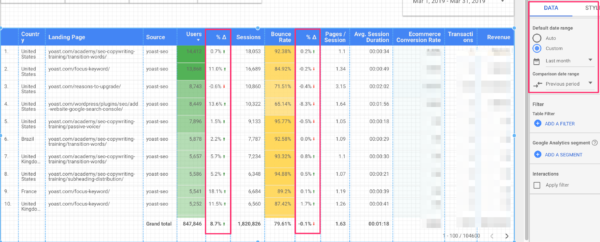
There are some cool features that you can add in the table itself. For instance, you can add heatmaps to your columns so that you can easily spot rows that stand out from others.
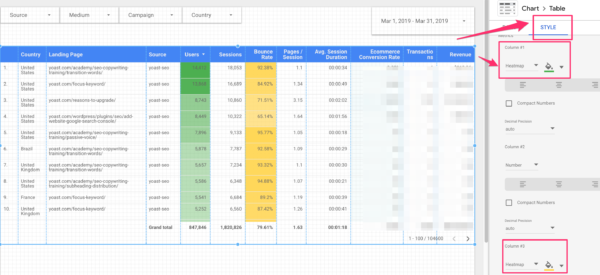
You can even compare date ranges so you can see if you’ve gotten, for example, more sessions from a particular source. And you can give it all the colors and fonts you want, keep the readability in mind though!
Conclusion
Starting with Google Data Studio is not as hard as you might think. And for me, it allows me to have more fun with Google Analytics data. If you catch yourself spending time on building the same reports, or adding the same secondary dimensions over and over again, it might be a good idea to just as well create that report in Google Data Studio. It will save you time and the cool thing is that you can share your report with others.
Read more: Learn how to create a Google Search Console dashboard »

thanks for the knowledge!
I want my website top ranking. Please advise.
Hi Anjna Gaur,
Thanks for your comment. Maybe the article How to rank high in Google can help you out!
Good luck,
Hanneke – Yoast
Hello,
Great article as always. I have been using Google Data Studio for a while now, pulls together reports that others can interpret far more easily.
Plus once its built, just amend the dates and you have a new report to present each month :D.
Thanks.
Thanks!
Hey,
Thank you for the information. I did not know about the Google Data Studio before. I’ll definitely try this out.
Hi Deepak Rathee,
You’re very welcome. Good luck!
Hanneke – Yoast
At first, I thought it was a useless tool from Google, since we can build our own reports in Analytics or Google Ads. But now I’m in love with Data Studio and it’s flexibility to build dashboards from many data sources. The only problem is that you get addicted with data!!
I know the problem haha!
Hey,
Thank you for the information. I did not know about the Google Data Studio before. I’ll definitely try this out.
Cheers
Athar Bhatt
Thank you! Let me know how if you think it’s worth the try!