Core Web Vitals report Search Console checks site speed

Google is rapidly expanding the capabilities of Search Console — its must-have tool for site owners/managers. We’ve seen a lot of cool structured data reports appear. In this post, we’re examining an enhancement report dedicated to site speed. It’s important to have a fast site with a good user experience and Google’s new tool helps you monitor it and improve it. Here’s is a quick guide to its capabilities.
What is the Core Web Vitals report in Google Search Console?
The Core Web Vitals report gives you an idea of how fast or slow your pages load over any given time. It gives you insights that were almost impossible to get up until now. Running page speed analysis on your complete site is not something the average user can do. Testing a couple of pages in PageSpeed Insights, fine, but 1,000 pages? The new Core Web Vitals report in Google Search Console gives you an idea of how your site loads. It puts all pages in buckets conveniently labeled poor, in need of improvement and good.
As you know, site speed and user experience have been a hot topic for quite a while. Google even declared page speed a ranking factor as well as new ranking factor called page experience. The search engine is rolling out all sorts of initiatives to help visualize site speed and prioritize improvements, like PageSpeed Insights and Lighthouse. Sometimes, Google also tries some outside the box changes like Chromes “speed badge of shame”. It is one of the indicators in the Chrome browser that helps users understand why a site may be loading slower. In reality, this is more a not so subtle jab at site owners to do something about their slow sites.
This focus on site speed is understandable. Site speed is user experience and users expect fast. But in regards to all those pretty numbers and colors, it’s hard to know what to look for. But as our own SEO expert Jono Alderson loves to say: “Don’t optimize for scores — just make it faster.” Scores say a lot, but all that matters is the perception of speed by users. How quickly can you make your page feel ready?
What does the Core Web Vitals report do?
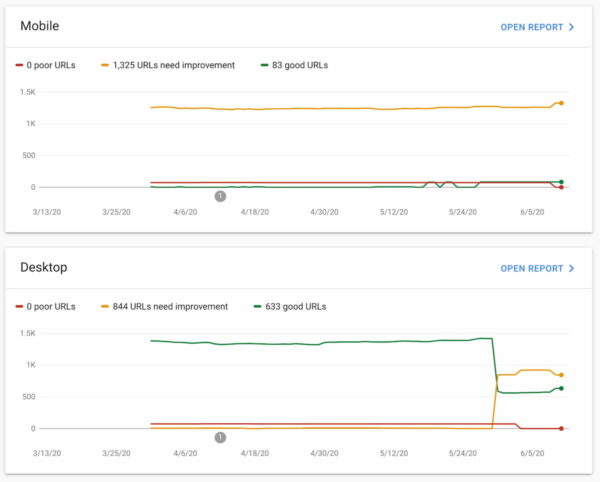
The Core Web Vitals report looks at the pages on your site, checks their scores in the Web Vitals data and puts these into buckets. There are mobile and desktop specific checks and these might differ. Due to hardware and network differences, it is harder to get a good score on mobile than it is on desktop. You’ll notice, though, that the same URLs are often troublesome both on mobile as well as desktop. They might load slightly faster due to changes in test setting, but they are a point of interest nonetheless.
While not the end-all tool for measuring site speed, the Core Web Vitals report is a valuable addition. It helps you find problematic URLs which you can check in PageSpeed Insights to get a deeper understanding — plus ways of fixing it. This way, you can keep an eye on all speed-related things, spot trends, make improvements and keep track of the results of those changes.
Where does it get its metrics?
The cool thing about the Core Web Vitals report is that it uses data from the Chrome UX Report. The Chrome UX Report is a public data set of real user experience data collected from millions of opted-in users and websites. This way, Google collects loads of data — like connection type, type of device and much more — from real situations and used to give a better understanding of performance in the real world. Google uses this data in several speed-oriented Google tools, like PageSpeed Insights and Lighthouse.
What should I look for?
When looking at site speed tools it is easy to focus on the wrong stuff. Many tools check site speed in particular circumstances, like a set location at one point in time, accessed from a specific device. There’s not enough context to make a decision based on this data. That’s why our advice in this has always been for you to look at a multitude of site speed tools. Combined these will give you a better handle on the problem.
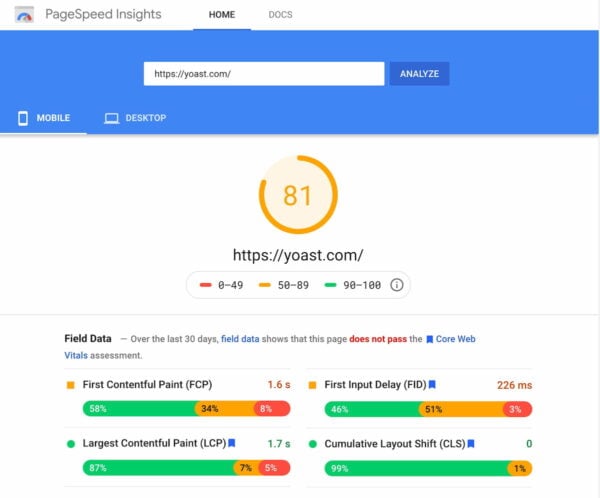
Google built the Search Console Core Web Vitals report around three metrics: FCP, FID and CLS. These three metrics form the Core Web Vitals. Here’s what these metrics mean:
- LCP, or Largest Contentful Paint: This metric tells how long it takes for the largest content element you see in the viewport to load.
- FID, or First Input Delay: The FID looks at how long it takes for a browser to respond to an interaction first triggered by the user (clicking a button, for instance).
- CLS, or Cumulative Layout Shift: The CLS measures how much layout elements move on screen during loading and how often that happens.
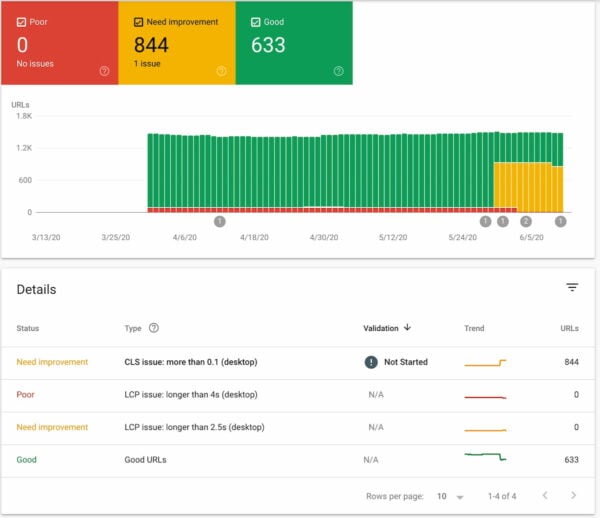
Reading the results
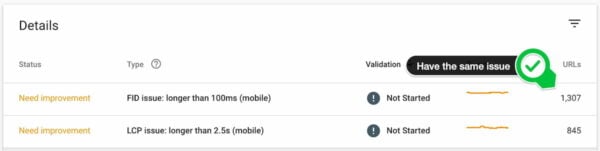
The results lead to an overview of pages that have good or poor scores, or are in need of improvement. The score of a URL is the lowest status assigned to it by a specific device. According to Google, the three metrics work together to come to a conclusion about the loading of the URL:
- A URL on mobile with Poor FID but Needs improvement LCP is labeled Poor on mobile.
- The URLs on mobile with Needs improvement LCP but Good FID are labeled Needs improvement on mobile.
- A URL on mobile with Good FID and CLS but no LCP data is considered Good on mobile.
- A URL with Good FID, LCP, and CLS on mobile and Needs improvement FID, LCP, and CLS on desktop is Good on mobile and Needs improvement on desktop.
These insights give you a good idea of how your pages are performing. As said before, you probably need to run a couple of more tests to get the full picture.
URL grouping
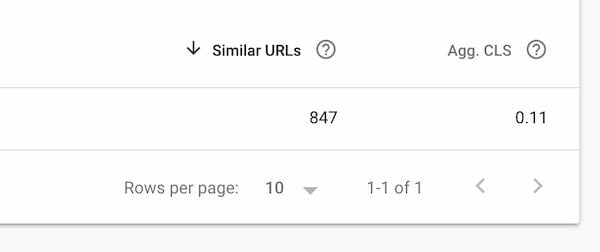
Instead of showing a gazillion URLs and the corresponding results, Google uses aggregate scores and URL groups to make the results slightly less intimidating. For any issue, you’ll see a number of URLs getting the same score or issue. So it might be that from a specific URL, 70 other URLs suffer from the same performance issues. That makes it easier to uncover issues on a grander scale because all these pages probably have the same problems. Of course, you can do a deep-dive and check individual pages by clicking on the URL list and picking a URL to analyze using PageSpeed Insights.
Aggregate scores
The same goes for scoring. Grouping makes it easier to digest the results. The Core Web Vitals report in Search Console focuses mainly on FCP and FID, as mentioned above. It’s a good idea to keep an eye on PageSpeed Insights as well, as this has a multitude of other metrics, graphics of the loading process and suggestions to improve the results.
In the Core Web Vitals report, Google calculates the FCP and FID from all the visits to those particular pages.
- Aggregate FCP: The aggregate first content paint is the time it takes for 75% of the visits to a URL in the report to reach FCP.
- Aggregate FID: The aggregate first interactive delay is the time it takes for 95% of the visits to that URL to respond to interactions on that page.
- CLS agg.: The aggregate cumulative layout shift shown in the report is the lowest common CLS for 75% of visits to a URL in the group.
The calculation of these scores continues to fluctuate due to outside influences. That’s why you might see the trend line go up and down.
Fixing issues and validating fixes
The Core Web Vitals report allows you to monitor your site for speed-related issues. It helps you find problems and prioritize their resolution. Once you or your developer have run through all the suggestions and improvements you can validate the fix. Google will then monitor the pages for 28 days to see if the issue is fixed for these URLs.
Site speed resources
This post is not about telling you how to fix your site speed issues, but rather guiding you through the new Core Web Vitals report that might give you the insights you need. To get practical, you can start here:
- Google’s Why Performance Matters article »
- Google’s Web Vitals documentation »
- 5 ways to improve your Core Web vitals »
- How site speed influences SEO »
- How to check site speed »
- Improving site speed: tools and suggestions »
- Site Speed Masterclass as part of the Yoast SEO Academy subscription
Last but not least, an incredible source of information: Jono’s slide deck on site speed from a talk at SMXL Milan.

What does it mean when you run your core vital report and it returns the message “not enough data for this device type”?
Hi Simone! This help article from Google might be able to help you with your question: https://support.google.com/webmasters/answer/9205520?hl=en
Thank for describing Google search console few feature (core web vital) but I have observed few sites with bad load time ranking higher in Google SERP. This’s little bit confusing, when Google say they want good user experience from websites but still they rank slower website top in result page.
Yes, I have seen this core web vitals in my search console report, it shows both desktop and mobile versions.
Thank you for the post, very helpful. A question for me is that the overall post number is way higher than the number of posts in the core web vitals section, for example, i have 10 posts in the coverage section, but only see 4 URLs under the core web vitals section. After a recent site migration, the number of URLs even got less, like 3 now. Can you help what does that mean? and how to fix if possible? Thank you!
I’v tried testing my own website both for the desktop and mobile version. The results are quite encouraging
Hi Munawar, that’s great, keep up the good work!
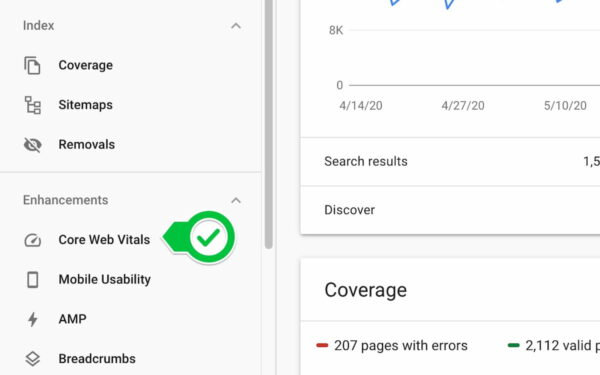
Where can I find this report in the search console?
Hi Mark. You can find the Core Web Vitals report in the Enhancements section of Google Search Console. I’ve added a screenshot to the article pointing it out.
When I click on “Core Web Vitals” is gives me this:
“Not enough data for this device type.
Learn more
Try PageSpeed Insights”
Hi Kenneth. Is your site new? Or have you only just added it to Google Search Console? It might take some time for Google to fill it with data. You can find more information in their help docs: https://support.google.com/webmasters/answer/9205520?hl=en
Your blog will help me to use search console more effectively.
Hi Abir, that’s great to hear! Good luck :)
web vital report is really helpful to check the analytics regarding the speed of any page of the website, I always lacked in tracking my website speed with different tools available in the market. Now the google itself has provided a great tool to monitor this. Overall this is good news for the blogger.
Hi John, we agree! This tool can definitely help you monitor and improve your site speed. Lots of luck with your site!