Checking mobile site speed and SEO with Google Lighthouse

Two words you often hear together are mobile and site speed. And that’s not without reason because these two go hand in hand. Mobile-friendliness and site speed are some of the most pressing matters we have to deal with. Measuring page speed has always been something of a dark art. The site speed tools we use today are fairly adequate, but with the new Web Vitals metrics Google is trying to come at it from a different, more realistic angle, taking page experience into account. Here, I’ll take a closer look at how to check your mobile site speed and SEO with Google Lighthouse.
What is Google Lighthouse?
Lighthouse is a page experience tool built by Google and was initially meant to audit Progressive Web Apps (PWA). The tool executes five audits for accessibility, performance, SEO, Progressive Web Apps and an extended list of best practices. Powered by the new Core Web Vitals, these audits together give you an excellent overview of the quality and performance of your mobile website as well as your desktop site, or web app.
Site speed is all about perception and user experience. Speed in numbers means nothing if your site still feels slow. Loads of users around the world are on rather crappy mobile connections of 3G or less. Even with lightning-fast 5G connections, a site can simply feel laggy and slow. And we all know what a devastating effect a slow site can have on your conversion. Shaving milliseconds of the time needed to load your site could make a world of difference. Not to mention the frustration that happens when a slow-loading ad pushes down the button you just wanted to click.
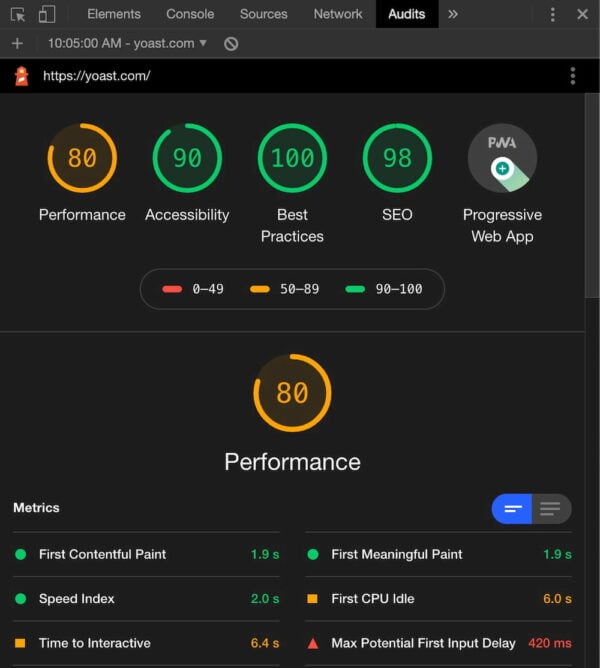
While testing, Google Lighthouse simulates visiting your mobile site via a flaky 3G connection on a slightly underpowered device. Packets are lost in an attempt to simulate real-world conditions as authentically as possible. These insights are combined with other data. After running the test, you’ll get a report with a score and actionable advice with issues to tackle.
PageSpeed Insights vs. Google Lighthouse
PageSpeed Insights is probably the most used site speed analysis tool out there. It gives you a nice score and a list of possible improvements, plus it gives you an idea of the perceived loading speed of your site. Also, PageSpeed Insights gives recommendations and identifies opportunities to improve the performance of your page. Some of these do tend to be hard implement, so getting a 100/100 is a pipe dream for most sites.
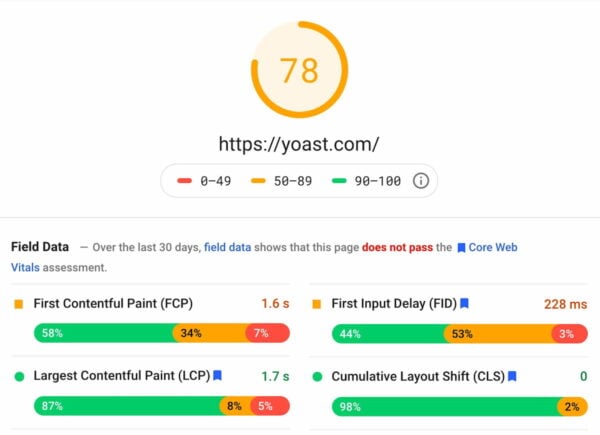
PageSpeed Insights and Lighthouse used to be two different tools for the job. They both provided valuable insights, but were hard to combine. With the advent of Web Vitals and the page experience update, Google improved the metrics across the board. Not only did they become easier to understand, they were also shared metrics. Of course, each tool is made for a specific subtask and offers specific metrics. These metrics come from different environments.
Field data vs. lab data
Web Vitals introduced new ways of determining performance. Some of these metrics can be calculated in a lab setting — simulated, so to say, while other metric only make sense if their are tested and collected in the field. In addition, some metrics work well in both settings. Google page experience tools use a variety of the metrics to provide you with the data you need to improve your site.
If you look closely, you’ll notice that some metrics only work in lab tools like the Developer Tools and Lighthouse. The field metrics appear in tools like the Web Vitals report in Search Console and PageSpeed Insights. The Core Web Vitals like LCP, FID and CLS will work everywhere.
Core Web Vitals
The brand-new Core Web Vitals will appear in all Google tools that measure site speed, performance and experience — even in the new Web Vitals report in Search Console. Now, you simply have to understand three basic metrics to get a sense of how your site or specific pages are performing. These Core Web Vitals are:
- LCP, or Largest Contentful Paint: Or, how long it takes for the largest content element you see in the viewport to load.
- FID, or First Input Delay: Or, how long it takes for a browser to respond to an interaction first triggered by the user (clicking a button, for instance)
- CLS, or Cumulative Layout Shift: Or, how much of the screen is affected by movement — i.e. does stuff jump around on screen?
These new Web Vitals take a much more practical approach and put user experience front and center. The tools visit your site over a throttled connection on an average device so it can emulate what a real visitor in the real world might experience. Instead of just loading your site like the classic speed tools used to do, these Web Vitals-powered tools check how and when it responds to input — and if stuff happens after the initial load. It finds the exact moment when your content is ready to use, so you can try and optimize that when it feels too slow. Plus, you can find annoyances that hinder a good page experience.
Also, keep in mind that Lighthouse not only measures performance, but also checks SEO, various best practices and accessibility. It is a complete tool that helps you improve your site holistically.
What to look for in Lighthouse results
The whole concept of speeding up your mobile site is two-pronged; your site must be fast, and it must feel fast. You, therefore, need to get your content on screen as fast as possible. Don’t let people wait. Also, users must be able to interact with your content as soon as possible. Since Google announced that page speed and page experience are ranking factors for SEO, you need to fix these issues.
What should your priority be? Load your content first. Awesome graphics and killer animations can wait. Your message – and what people are looking for – is most likely in the content. You can load the rest of the content in the background and ease it on the screen later on.
Performance metrics used by Lighthouse 6.0
While measuring the performance of your site, Lighthouse 6.0 uses the following metrics:
- First Contentful Paint: FCP measures how long it takes the browser to render the first piece of DOM content after a user navigates to your page. This includes, images, non-white
<canvas>elements, and SVGs but excludes stuff inside an iframe. - Speed Index: The Speed Index measures how quickly content is visually displayed during page load.
- Largest Contentful Paint: The LCP is all about how long it takes for the largest content object (for instance, an image or a block of text) to load. This is one of the most important new metrics. Here, having a good score means users perceive your site as loading quickly.
- Time to Interactive: TTI measures the time it takes from loading the page to when it is capable of reliably responding to user input quickly. The page might look quick to load, only to find that pushing some buttons doesn’t do anything yet.
- Total Blocking Time: The TBT measures the time between the FCP and TTI where blockades can happen, preventing responsiveness.
- Cumulative Layout Shift: The CLS looks at the number of layout shifts that happen during the full loading process of the page. Every time an element jumps around on the screen from frame to frame, this counts as a layout shift. Remember those nasty ads that load at the last moment?
You can see how your score is calculated by going to the Lighthouse Scoring Calculator:
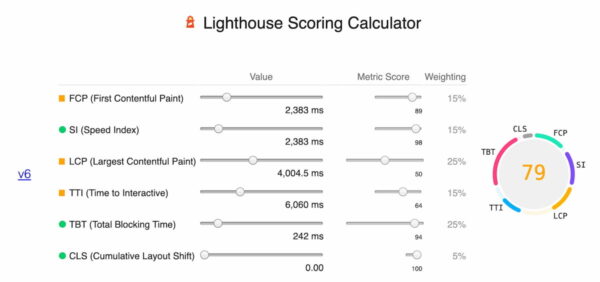
The Lighthouse report also features some opportunities to improve the site speed of your mobile site, including how much loading time they will save. These include reducing render-blocking stylesheets, render-blocking scripts, properly sizing images and fixing offscreen images.

All in all, Lighthouse gives you tremendous insight into your page’s performance. Use these insights to your advantage.
The Lighthouse SEO check
Lighthouse doesn’t just do performance; it also has an accessibility test, suggestions on improving your site based on best practices, and a PWA analysis. Another cool Lighthouse feature is the basic SEO check. With this check, you can run a simple SEO audit to uncover a site’s basic SEO issues. It gives you suggestions on how to fix them as well. Since Lighthouse runs locally in your browser, you can also run the checks on your staging environment.
Currently, Lighthouse checks:
- The mobile-friendliness of a page
- If the structured data is valid
- Does it have a
<meta name="viewport">tag withwidthorinitial-scale - Does the document have a
<title>element? - Is there a meta description?
- Does the page have a successful HTTP status code?
- Do links have descriptive anchor text?
- Does the document use legible font sizes?
- Is page not blocked from indexing?
- Is the robots.txt valid?
- Do images have alt attributes?
- Does the document have a valid hreflang implementation?
- Does the document have a valid rel=canonical set up?
- Are there any unwanted plugins like Java or Flash?
Although basic, the Lighthouse checks will alert you of any SEO problems to fix.
How to install Google Lighthouse
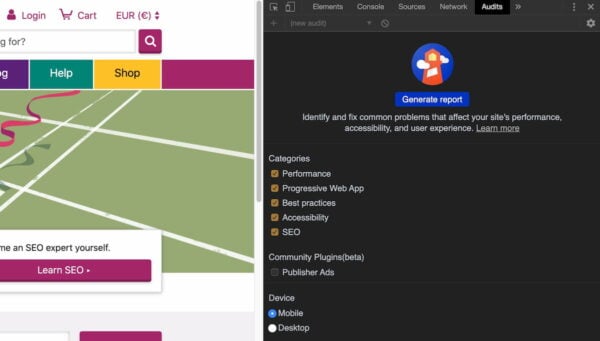
Getting started with Google Lighthouse is very easy as it is built into Chrome’s Developer Tools Audit panel (Mac: Shift+Cmd+I. Win: Ctrl+Shift+J or F12). From there, you can run the test and get the full report. In addition, there is a separate Chrome add-on for Lighthouse that adds a button to your toolbar, though using it stays the same with a few restrictions : you can’t validate sites on your local server and authenticated pages also won’t work.
You can also run Lighthouse as a Node package. This way, you can incorporate the test into your build process. When using the Node package, you will also see that there are a couple of audits that only work in a Node environment and not in the Audits panel of the DevTools.
To install Lighthouse globally from the command line use:
npm install -g lighthouse
If you want to run a test for https://example.com use:
lighthouse https://example.com
The full results of the audit will be available in the terminal, but also in a separate HTML file.
Testing Yoast.com in Lighthouse
It’s time to put Lighthouse through its paces. Let’s see what happens when I shine the spotlight of the lighthouse on yoast.com — as seen by a mobile browser. Today, we’re only focussing on the Performance tab. This tab shows how your site or app performs currently and shows you ways to improve it.
In the screenshot below, you can see the results for yoast.com. The initial loading of the mobile site is visualized by a number of screenshots showing when the content first appears onscreen. The metrics show how long it takes for the content to become visible. The faster, the better.
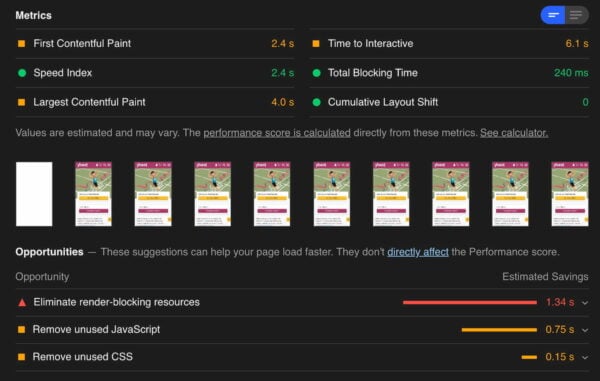
In the metrics section, you’ll find the most important information, with a green, orange or red dot to show how good the performance is. When you want to optimize the performance of your mobile site, you need to watch the figures for first contentful paint, largest contentful paint and time to interactive, as mentioned earlier. Also, try to improve the speed index and make sure that nothing jumps around on screen.
From the grades, you can see that yoast.com does pretty well with a 78 overall score. The first contentful paint could be a bit better, but the speed index and total blocking time are good. Luckily, there are no elements found shifting in the layout. There’s still something to gain by eliminating render-blocking resources, like some JavaScript and CSS. In other words, the site appears to be rather fast but still could use some speeding up in the appearance part.
Implementing site speed fixes
There’s a lot you can do to improve your site speed. While explaining all the fixes is beyond the scope of this post, many optimizations can be found in the critical rendering path. The critical rendering path is formed by objects – like CSS and JavaScript – that have to load before the content can show up on screen. If this content is blocked, your page will render slowly or not at all. Pay attention to this and keep the path free of obstacles. Google’s Ilya Grigorik wrote a great guide on how to understand and improve the critical rendering path. And please, optimize your images! Last but not least, don’t forget to read up on Google’s new Web Vitals.
Try it!
Google Lighthouse isn’t the one site speed tool to rule them all, but it is a very valuable addition to your toolkit. The SEO checks are basic, but welcome nonetheless. Lighthouse is more fine-grained and gives you immediate feedback based on real-world usage. You should definitely use it along with your other page speed test tools, like PageSpeed Insights, WebPageTest and Pingdom.
Are you using Google Lighthouse? How do you find it? Please share your experiences and tips in the comments. I would love to hear from you!


Thank you so much for this article. This is a really handy tool, especially showing what’s slows a page down. Finally, something I can use to optimize my site for speed and score!
Great to hear it! Good luck with your optimizing :)
I thing the comparison between google Light house and page speed insights was done well in this article. Definitely going to use this tool for my website.
Thank you, Mark! We’re glad to hear it. Lots of luck with your optimizing!
Thank you so much for this article and yes google lighthouse is really handy but I have a question. There are also other good tools available for this and they show different result for the same website. And this is annoying!
Hi Deepak, That’s true, different tools might give different values as they focus on different aspects. Perhaps try to improve these scores one by one?
Thanks!
So helpful article. Thank you so much for posting.
You’re welcome, Romel :)
This is a really handy tool, especially showing what’s slows a page down. Great for refining a website and boosting speed.
its great,
but my website speed is showing different fo tool to tool how to maximize it
Hi there! That can happen, as things on your site are not always static. Or the tools you use might focus on different aspects.
This article can give you some tips on how to optimize your speed: https://yoast.com/site-speed-tools-suggestions/
I am really impressed looking the post..
But i have a question how can i optimized more speed for my webste ?
Please help me..
Hi there!
Thank you very much :) If you’re looking for ways to speed up your site, I would recommend reading this article: https://yoast.com/site-speed-tools-suggestions/
Good luck!
Great comparison and guide. Finally, something I can use to optimise my site for speed and score!
Thanks, Reginald, and good luck optimizing!
All of the WordPress sites we work with are getting flagged for unused JavaScript by PageSpeed Insights. However, the unused JavaScript Google identifies is the CDN and Google tracking scripts (ads & tag manager). Any thoughts on how these scripts could be updated to not adversely affect speed/performance? I would assume this is an issue for most WordPress sites. Thanks
Hi,
Thanks for a helpful article.
When I ran Lighthouse in the Chrome Developer Tools window on one of my pages I got this error:
PROTOCOL_TIMEOUT
“`
Channel: DevTools
Initial URL: https://karenswhimsy.com/mothers-day-clip-art/
Chrome Version: 83.0.4103.61
Stack Trace: LHError: PROTOCOL_TIMEOUT
at eval (devtools://devtools/remote/serve_file/@94f915a8d7c408b09cc7352161ad592299f384d2/lighthouse_worker/lighthouse_worker_module.js:1268:229)
“`
Any idea how I can get more info on this or what I could do next?
Thank you!
Hi Karen. That’s unfortunate! Strange, as I’ve never ran into that issue, but after searching on Google, I see a lot of people running into it. You can more info on that here: https://github.com/GoogleChrome/lighthouse/issues/6512. Unfortunately, I haven’t found a solution. For now, you can also run the check on https://web.dev/measure/. This should give you access to the full Lighthouse report.
I would have appreciated more about how to run the Lighthouse test. I followed the instructions to start the test in Chrome, and then was presented with a page that looked nothing like in the article. That was because (I assume) it had defaulted to the Network tab. I switched to the Performance tab (because that seemed likely to me) and now 1/2 hour later it’s still “Profiling”. I have no idea if that’s correct or not.
Very useful information. I want some information on Best Hosting Providers. Please write an article on this topic. Thanks
Thanks, glad to hear the article was of use to you! We have a page about WordPress hosting companies you’ll probably find interesting, check it out here: https://yoast.com/wordpress-hosting/
Yoast really helped me in the ranking. I really like this plugin
Thanks for your kind words, that’s great to hear! Good luck with your SEO :)
I have noticed that every time I check the site speed, it gives a different value – not sure why does that happen!
Hi Mainak! Well spotted; it can happen as things often aren’t static! Different tools can also give different results because they focus on different aspects. Hope that helps, good luck!
i really like yoast SEO i always use this plugin for wordpress. and also this article is nicely written on Speed. i appreciate it.
Thanks, Kamran! Hope it helps you :)
Very good plugin i easily manage my website with this plugin. And my website speed is also increase Thank you so much .
So by having Google Adsense on your site drops your score by allot when you have a header banner. Then Google punishes wants you to use Adsense but at the same time dosent??
Thanks for your comment, and kind words! And well done on increasing your site speed, that’s great to hear!