How to do a one-page analysis in Google Analytics

I often get a request from our Blog team about one of their pages. Sometimes they want to know if the page has gotten more pageviews or they notice something weird and they want me to find out what’s going on. And this time they wanted more insight in the performance of one particular page. I want to share with you how I deal with this request.
So the other day I got a request to check the performance of our Blog homepage. We want to optimize that page so it fits better with the need of our audience. If you have an idea about that, you can leave your feedback in the comments section below this post.
Page level analysis
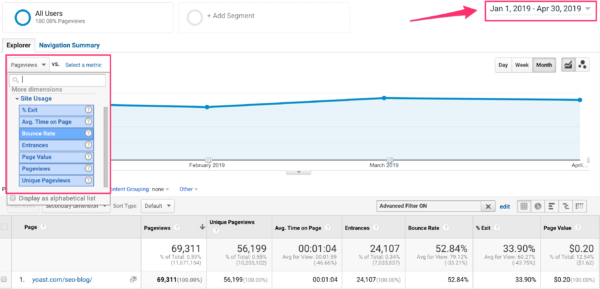
The first thing I had a look at is how ‘popular’ the page is and if it’s worth the effort to spend time and resources on this page. I went to the All pages report in Google Analytics, which you can find under Behavior –> Site content and did a cmd+F or ctrl+F search for the page https://yoast.com/seo-blog/. If you can’t find the page you’re looking for; it’s because it probably isn’t within the first ten results. So you need to expand your table first; you can do this on the right bottom of the table.
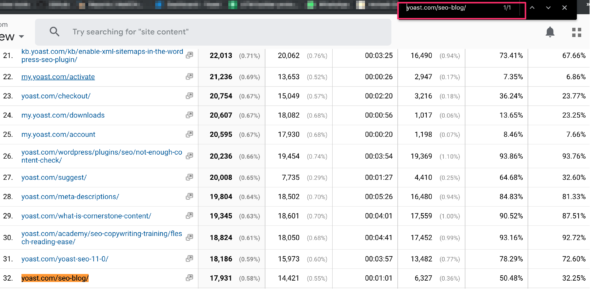
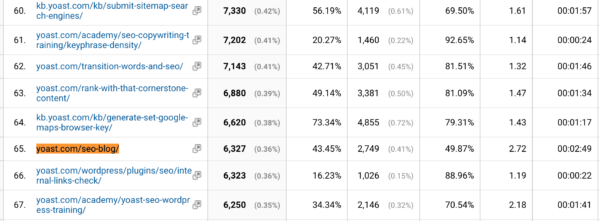
I notice it’s at position 32 if you look at the number of pageviews, which is a reasonably high position and thus worthy of further investigation. I also notice that in 6,327 of the cases it’s an entrance page, this means it’s in 35,3% of the cases the first page of the session (6,327 / 17,931 * 100).
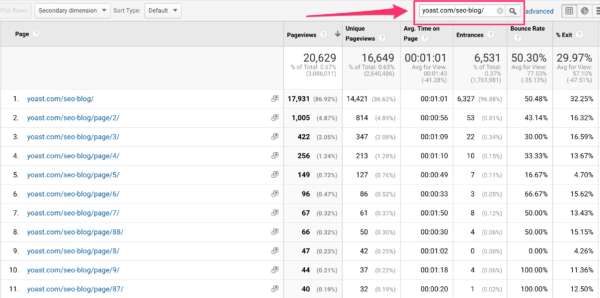
You can also search for a specific post in the search bar to see just the metrics of that page but sometimes other pages show up as well.
If the page is in blue letters, it means you can specify even further when clicking on it because it’s a link. Or you can use regex; regex stands for “regular expression”. Lunametrics made this fun regex guide that shows you how you can use regex in Google Analytics. It may sound a bit scary, but if you know the basics, it’s quite doable and will make your Google Analytics life a whole lot easier. Here’s how a regex would look if I just wanted the SEO blog homepage:
^yoast\.com\/seo-blog\/$
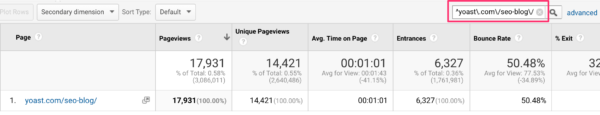
But in this case, you can just as well click on the page to see just the metrics of that page. Try to understand what the metrics are saying and how it compares to the site’s average. In this case, for a page that’s built to guide people to blog posts of their interests, a bounce rate of 50.48% is fairly high. That means that in half of the cases, people didn’t do anything on that page! That’s not what the page is designed for.
I was also curious to see if this page gets a lot of mobile traffic, so I added a secondary dimension with the Device category. I then checked what the metrics told me.
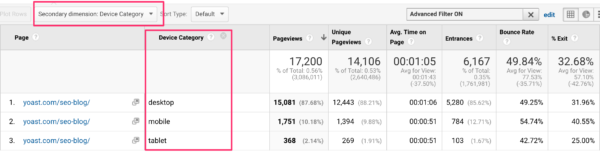
About 10% of the page views come from a mobile device. You can see it has a higher bounce rate so checking the mobile experience is a good idea.
Trend analysis
And, I was curious to see how the page developed over time, so I added a wider timeframe to check if I saw something unusual. You can adjust the graph you’re seeing. Perhaps you’re interested if Bounce rate declined or not. You can select this metric and you’ll see the trend of the bounce rate of that page.
Session level analysis
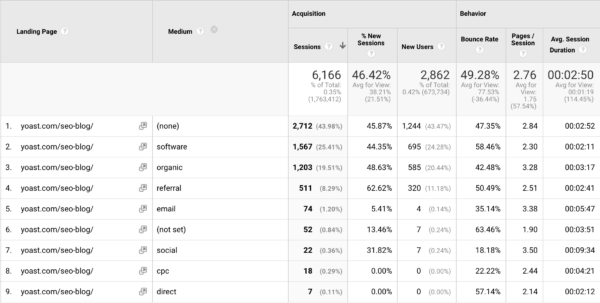
I then looked at this page from a page level. But, I had more questions about this page. If people are entering our site through this page, where are they coming from? So, I had a look from a session level perspective. I went to landing pages and did the same search as in the All pages report.
It’s at position 65 and obviously has 6,327 sessions since we saw that in the All pages report at entrances. I once again looked at the metrics and tried to understand what they’re telling me. The number of pages per session, the bounce rate and the number of ‘new’ users. And I had a look at conversions.
I then dove in further, clicked on the page and added a secondary dimension: medium, so I could quickly see where traffic is coming from. I noticed that we have a lot of traffic that we don’t know the source of. So that’s something to explore further. In second position comes our plugin and third is organic search traffic. Which is interesting to see because I’m curious with what keywords people end up on that page and if we rank properly on that keyword or keyphrase. With that information, we can improve the SEO of that page even further.
Again, I had a look at bounce rates, pages per session, number of new users and possible conversions. Thinking about if the page is doing what it’s supposed to do.
Google Search Console analysis
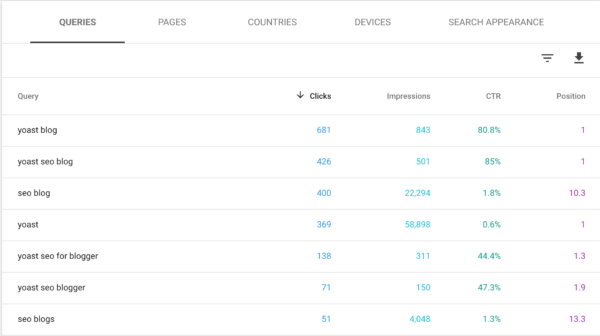
I needed to go to Google Search Console to find information about the keywords or keyphrases the blog homepage ranks for. You go to your Google Search Console account and click on Search results. Then you set a filter that exactly matches the URL of your page, in our case: https://yoast.com/seo-blog/.
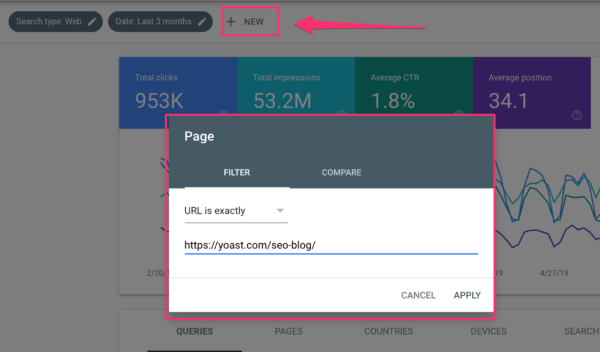
You now see the queries and position of that page. Take a look at the metrics and try to understand what’s going on. It’s especially interesting if you have a lot of impressions but a low clickthrough rate (CTR).
Conclusion
What can we learn from this analysis? For one is that it’s worth the while to put some time and effort into this page. I learned that we can optimize the SEO of that page even further and that we can put some more effort into ranking for the keyword SEO blog.
I also noticed that it’s quite a popular page, but the bounce rate is too high for my taste. Especially when the goal of the page is to guide people to a blog post of their interest. So, there needs to be interaction with this page. We need to find out what people expect to find on this page. So, therefore, extra information is needed. That’s why we added a simple poll on this page, using Hotjar. We also created a heatmap with this tool to get a better understanding of how people behave on the page.
Combining data gives you a far more holistic view and will make sure you can draw more reliable conclusions. Data we can use to optimize the blog homepage even further. The perfect dataset doesn’t exist but we can try to get as far near perfection as possible.
Read more: How to prepare yourself for Google Analytics 4 »

Very interesting content. You are very insightful. You ask us to share our ideas of how to do it, but I you are near perfection I think.
Thanks for the article. Should I use Yoast SEO premium for this feature?
I love using analytics. I have just check my site content in analytics and tried to improve some on page seo with the help of yoast seo. Well, let see how my ranking improve.
Thanks for this amazing content.
very impressive and valuable post for me because i read some other articles but, what i wanted to need i got in this post.
Thank you
Great tips as usual.
Your analysis is very helpful to me, please keep continue to it for guiding bloggers. Thanks.