Insights in Instagram analytics

Instagram isn’t yet the traffic source Facebook is. But Instagram is growing rapidly. Just last month, the milestone of 500 million users was reached. It makes you wonder whether or not to incorporate Instagram into your default marketing mix, right? Therefore, it would be nice to have Instagram analytics.
In 2015, 33% of US teens chose Instagram as their personal number one social network. Of all the Instagram users, about 50% is male. 96 percent of US fashion brands use Instagram. Those are all impressive stats, but what about your Instagram account? What are the stats on that? For these numbers, you’d say you have to dig into Instagram analytics, right? I found no such thing. Facebook has Insights, Twitter has Analytics, Pinterest has Analytics, YouTube has Analytics, Instagram has… no such thing. There is no native analytics for Instagram. Facebook Ads for Instagram gives some insights, but that is just for the companies advertising on the social platform.
How do I get to my Instagram Analytics!?
I can’t imagine that Instagram won’t roll out Instagram Analytics (or Instagram Insights, following Facebook Insights) at some point in the future. But it won’t be rolling out as fast as Pokemon Go, that much is clear. There are some stats in business insights for advertisers, but hey, not all of us advertise on Instagram. As far as I know, these business tools are still a work in progress and not available to all. Brand Profiles will be limited to companies that have a Facebook Page (for now?). Be sure to check this article for more insights on those stats. Long story short, for the time being, we have to fall back on third-party applications. And that works pretty well, actually!
Third party Instagram Analytics apps
There are a ton of iOS and Android apps for Instagram, and a lot of these are apps that give you stats. Most provide an overview of things like new followers or most popular media. All of these apps seem centered around this information:
- New followers
- Lost followers
- Users that are not following you back (called ‘non-followers’)
- Followers that you don’t follow back (called ‘fans’)
This is the standard information every one of those apps gives for free. And to be honest, I wouldn’t waste my money on the other intel these apps provide. Although it’s quite hard to publish on Instagram from your desktop, the third party analytics apps have a way better overview than most mobile apps. Again, there are tons of desktop/browser apps available. Apps like Minter.io or Quintly handle more social networks than just Instagram. These cost a nice monthly fee and will tell you more about your social efforts and the effects they have.
In this article, I’d like to focus on another tool that I find very handy for my Instagram Analytics: Iconosquare.
Iconosquare
Iconosquare has a free trial, and after that, it costs you from $49/yr (per IG account) up to $499/yr. Key differences between the packages are these:
- The cheapest package doesn’t allow for hashtag monitoring
- The more expensive ones add competition monitoring
- Comments will be tracked for the last 5, 15 or 30 media
- The most expensive one includes photo and video contests
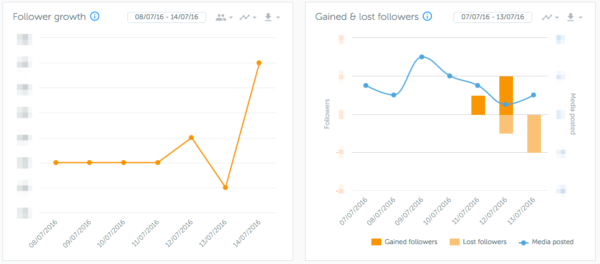
They all include a variety of interesting stats. Your Iconosquare dashboard will show you Instagram analytics like your follower growth and the number of lost and gained followers, much like the other apps I mentioned.
It will show you the love, talk, and engagement rate of your Instagram posts:
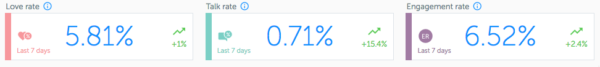
- Love rate is based on the likes given by your followers divided by the number of followers at the time of the post.
- Talk rate is based on the comments received from your followers divided by the number of followers at the time of the post.
- Engagement rate is based on the likes and comments received divided by the number of followers at the time of the post.
Makes sense, right? Next to that, Iconosquare will tell you what your most liked, most commented and most engaging media is. You can base your Instagram strategy on that: post more of what is popular among your audience.
Engagement
For better insights in your posts, check the Engagement section of the tool. It will tell you things like average likes or comments, but also what Instagram filters work best. The one that works best for me is Aden. I have to say that that name isn’t directly ringing a bell for me, as I usually pick a filter by what it does to the photo, not the name :)
Furthermore, the engagement section holds tag cloud with your most-used tags, which I like as I am a heavy tag user these days. Tags simply work like a charm to trigger engagement with / market towards new people.
Best time to post
What I like as well, is the Best time to post – Engagement rate table. It will tell you when your posts trigger the most engagement with your audience. The darker the square, the better the engagement is:
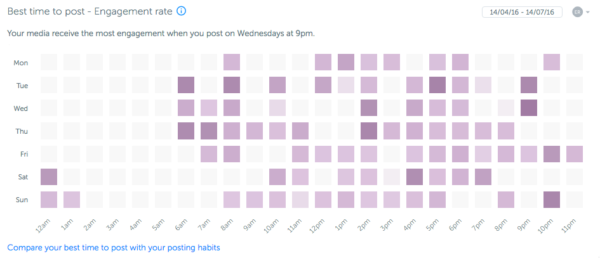
To me, that is one of the most important pieces of information Iconosquare provides. It’s good to optimize posting times, using for instance Later.
Community
Another section in this Instagram analytics app is Community. This section provides information about your followers, like their location or the structure of your community (how many followers have your followers):
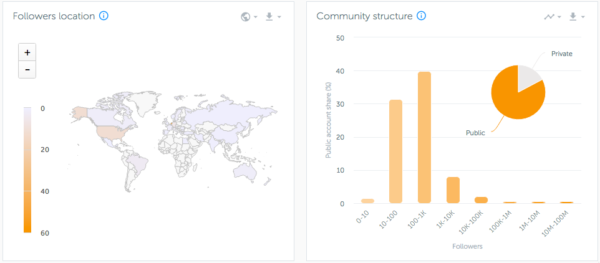
You can zoom that world map, by the way. Makes it a bit easier to analyze!
Another interesting section is the “Top Followers” section. It shows you the followers with the most followers, so to say. You know that you will reach the most people when you interact with these followers (comments, likes)will be seen by the most people. So be sure to do that as well, to grow your following towards their numbers.
To sum things up
Even though there is no such thing as Instagram Analytics (yet), there are lots of ways to get these valuable insights about your efforts and followers. I think Instagram will make its own analytics available, maybe even for non-business Instagram users. If that time comes, I’ll be one of the first to write the insights about that on this blog :)
Read more: Facebook Page Insights explained »
When instagram rolling out business account for outside us customers
Instagram have rolled out a business account to US users also. A bit like how Pinterest did it where you can convert your personal account to business. It has it own in-app analytics but would be interesting to see if it matches that of Iconosquare. Either way, ICQ is useful to stay on top of community engagement.
Don’t know if only I have this problem but data from in-app analytics and Iconosquare are different. Instagram did a great move by launching business acounts.
Instagram is huge, i think that everybody who wants to build strong account on instagram need an analytics tool like Iconosquare !
I agree Tim, you have to be a visual company to use Instagram so it limits the benefits for different business’. Where as we are a internet Marketing Agency it isn’t to bad to post designs. But for say Finance companies it wouldn’t be that beneficial.
Nice blog from Yoast yet again.
Cheers guys
Cory
Instagram is just now starting to display this data natively in the app. We’re a visual company and the insights are very valuable. Instagram as a platform has been really beneficial to our business.