From slow to super fast: how to boost site speed the right way

Did you know that even a one-second delay in page loading speed can cause up to 11% fewer page views? That’s right, you might have the best content strategy and a solid plan to drive traffic, but visitors won’t stay long if your site lags. Page speed is one of the biggest factors in keeping users engaged and converting.
In this guide, we’ll uncover the most common causes of slow websites and explore proven ways to boost website performance. Whether your site feels sluggish or you simply want to make it faster, these insights will help you identify what’s holding it back and how to fix it.
Key takeaways
- Page speed significantly affects user experience and conversion rates, with even minor delays leading to increased bounce rates
- Improving website performance involves optimizing hosting, reducing file sizes, and enhancing code quality
- Fast-loading sites rank better on Google, as page speed is a critical ranking factor, especially for mobile searches
- Key metrics to monitor include Largest Contentful Paint, Interaction to Next Paint, and Cumulative Layout Shift
- Use tools like Google PageSpeed Insights and WebPageTest to measure and diagnose performance issues effectively
What do we mean by ‘website performance’ and why is it important for you?
Website performance is all about how efficiently your site loads and responds when someone visits it. It’s not just about how fast a page appears; it’s about how smoothly users can interact with your content across devices, browsers, and locations. In simple terms, it’s the overall quality of your site’s experience that should feel fast, responsive, and effortless to use.
When your page loading speed is optimized, you’re not only improving the user experience but also setting the foundation for long-term website performance.
Here’s why it matters for every website owner:
Fast-loading sites have higher conversion rates and lower bounce rates
Attention spans are notoriously short. As the internet gets faster, they’re getting shorter still. Numerous studies have found a clear link between the time it takes a page to load and the percentage of visitors who become impatient while waiting.
By offering a fast site, you encourage your visitors to stay longer. Not to mention, you’re helping them complete their checkout journey more quickly. That helps improve your conversion rate and build trust and brand loyalty. Think of all the times you’ve been cursing the screen because you had to wait for a page to load or were running in circles because the user experience was atrocious. It happens so often, don’t be that site.
A fast page improves user experience
Google understands that the time it takes for a page to load is vital to the overall user experience. Waiting for content to appear, the inability to interact with a page, and even noticing delays create friction.
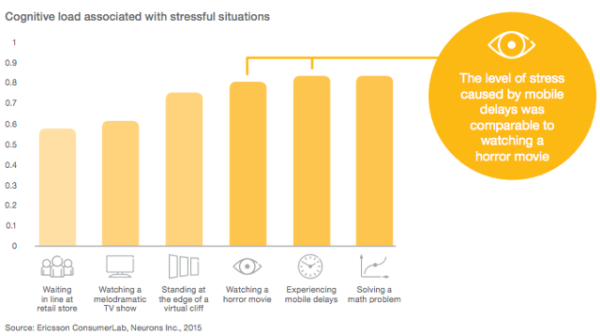
That friction costs time, money, and your visitor’s experience. Research shows that the level of stress from waiting for slow mobile results can be more stressful than watching a horror movie. Surely not, you say? That’s what the fine folks at Ericsson Research found a few years back.
Improving your site speed across the board means making people happy. They’ll enjoy using your site, make more purchases, and return more frequently. This means that Google will view your site as a great search result because you are delivering high-quality content. Eventually, you might get a nice ranking boost.
Frustration hurts your users and hurts your rankings
It’s not just Google – research from every corner of the web on all aspects of consumer behavior shows that speed has a significant impact on outcomes.
- Nearly 70% of consumers say that page speed impacts their willingness to buy (unbounce)
- 20% of users abandon their cart if the transaction process is too slow (radware.com)
- The BBC found that they lost an additional 10% of users for every additional second their site took to load
These costs and site abandonment happen because users dislike being frustrated. Poor experiences lead them to leave, visit other websites, and switch to competitors. Google easily tracks these behaviors (through bounces back to search engine results pages, short visits, and other signals) and is a strong indicator that the page shouldn’t be ranking where it is.
Google needs fast sites
Speed isn’t only good for users – it’s good for Google, too. Slow websites are often inefficient. They may load too many large files, haven’t optimized their media, or fail to utilize modern technologies to serve their page. That means that Google has to consume more bandwidth, allocate more resources, and spend more money.
Across the whole web, every millisecond they can save, and every byte they don’t have to process, adds up quickly. And quite often, simple changes to configuration, processes, or code can make websites much faster with no drawbacks. That may be why Google is so vocal about its education on performance.
A faster web is better for users and significantly reduces Google’s operating costs. Either way, that means that they’re going to continue rewarding fast(er) sites.
Improving page speed helps to improve crawling for search engines
Modern sites are incredibly wieldy, and untangling that mess can make a big difference. The larger your site is, the greater the impact page speed optimizations will have. That not only impacts user experience and conversion rates but also affects crawl budget and crawl rate.
When a Googlebot comes around and crawls your webpage, it crawls the HTML file. Any resources referenced in the file, like images, CSS, and JavaScript, will be fetched separately. The more files you have and the heavier they are, the longer it will take for the Googlebot to go through them.
On the flip side, the more time Google spends on crawling a page and its files, the less time and resources Google has to dedicate to other pages. That means Google may miss out on other important pages and content on your site.
Optimizing your website and content for speed will provide a good user experience for your visitors and help Googlebots better crawl your site. They can come around more often and accomplish more.
Page speed is a ranking factor
Google has repeatedly said that a fast site helps you rank better. It’s no surprise, then, that Google has been measuring the speed of your site and using that information in its ranking algorithms since 2010.
In 2018, Google launched the so-called ‘Speed Update,’ making page speed a ranking factor for mobile searches. Google emphasized that it would only affect the slowest sites and that fast sites would not receive a boost; however, they are evaluating website performance across the board.
In 2021, Google announced the page experience algorithm update, demonstrating that page speed and user experience are intertwined. Core Web Vitals clearly state that speed is an essential ranking factor. The update also gave site owners metrics and standards to work with.
Of course, Google still wants to serve searchers the most relevant information, even if the page experience is somewhat lacking. Creating high-quality content remains the most effective way to achieve a high ranking. However, Google also states that page experience signals become more important when many pages with relevant content compete for visibility in the search results.
Google mobile-first index
Another significant factor in page speed for ranking is Google’s mobile-first approach to indexing content. That means Google uses the mobile version of your pages for indexing and ranking. This approach makes sense as we increasingly rely on mobile devices to access the internet. In recent research, Semrush found out that 66% of all website visits come from mobile devices.
To compete for a spot in the search results, your mobile page needs to meet Core Web Vitals standards and other page experience signals. And this is not easy at all. Pages on mobile take longer to load compared to their desktop counterparts, while attention span stays the same. People might be more patient on mobile devices, but not significantly so.
Take a look at some statistics:
- The average website loading time is 2.5 seconds on desktop and 8.6 seconds on mobile, based on an analysis of the top 100 web pages worldwide (tooltester)
- The average mobile web page takes 15.3 seconds to load (thinkwithgoogle)
- On average, webpages on mobile take 70.9% longer to load than on desktop (tooltester)
- A loading speed of 10 seconds increases the probability of a mobile site visitor bouncing by 123% compared to a one-second loading speed (thinkwithgoogle)
All the more reasons to optimize your website and content if your goal is to win a spot in the SERP.
Understanding the web page loading process
When you click a link or type a URL and press Enter, your browser initiates a series of steps to load the web page. It might seem like magic, but behind the scenes, there’s a lot happening in just a few seconds. Understanding this process can help you see what affects your page loading speed and what you can do to boost website performance.

The process of loading a page can be divided into three key stages:
Network stage
This is where the connection begins. When someone visits your site, their browser looks up your domain name and connects to your server. This process, known as DNS lookup and TCP connection, enables data to travel between your website and the visitor’s device.
You don’t have much direct control over this stage, but technologies like content delivery networks (CDNs) and smart routing can make a big difference, especially if you serve visitors from around the world. For local websites, optimizing your hosting setup can still help improve overall page loading speed.
Server response stage
Once the connection is established, the visitor’s browser sends a request to your server asking for the web page and its content. This is when your server processes that request and sends back the necessary files.
The quality of your hosting, server configuration, and even your website’s theme or plugins all influence how quickly your server responds. A slow response is one of the most common issues with slow websites, so investing in a solid hosting environment is crucial if you want to boost your website’s performance.
One popular choice is Bluehost, which offers reliable infrastructure, SSD storage, and built-in CDN support, making it a go-to hosting solution for many website owners.
Browser rendering stage
Now it’s time for the browser to put everything together. It retrieves data from your server and begins displaying it by loading images, processing CSS and JavaScript, and rendering all visible elements.
Browsers typically load content in order, starting with what’s visible at the top (above the fold) and then proceeding down the page. That’s why optimizing the content at the top helps users interact with your site sooner. Even if the entire page isn’t fully loaded yet, a quick initial render can make it feel fast and keep users engaged.
Key causes that are causing your website to slow down
While you can’t control the quality of your visitors’ internet connection, most slow website issues come from within your own setup. Let’s examine the key areas that may be hindering your site’s performance and explore how to address them to enhance your website’s performance.
Your hosting service
Your hosting plays a big role in your website’s performance because it’s where your site lives. The speed and stability of your host determine how quickly your site responds to visitors. Factors such as server configuration, uptime, and infrastructure all impact this performance.
Choosing a reliable host eliminates one major factor that affects speed optimization. Bluehost, for example, offers robust servers, reliable uptime, and built-in performance tools, making it a go-to hosting choice for anyone serious about speed and stability.
Your website theme
Themes define how your website looks and feels, but they also impact its loading speed. Some themes are designed with clean, lightweight code that’s optimized for performance, while others are heavy with animations and complex design elements. To boost website performance, opt for a theme that prioritizes simplicity, efficiency, and clean coding.
Large file size
From your HTML and CSS files to heavy JavaScript, large file sizes can slow down your website. Modern websites often rely heavily on JavaScript for dynamic effects, but overusing it can cause your pages to load slowly, especially on mobile devices. Reducing file sizes, compressing assets, and minimizing unnecessary scripts can significantly improve the perceived speed of your pages.
Badly written code
Poorly optimized code can cause a range of issues, from JavaScript errors to broken layouts. Messy or redundant code makes it harder for browsers to load your site efficiently. Cleaning up your code and ensuring it’s well-structured helps improve both performance and maintainability.
Images and videos
Unoptimized images and large video files are among the biggest causes of slow websites. Heavy media files increase your page weight, which directly impacts loading times. If your header image or hero banner is too large, it can delay the appearance of the main content. Optimizing your media files through compression, resizing, and Image SEO can dramatically improve your website’s speed.
Too many plugins and widgets
Plugins are what make WordPress so flexible, but adding too many can slow down your site. Each plugin adds extra code that your browser needs to process. Unused or outdated plugins can also conflict with your theme or other extensions, further reducing performance. Audit your plugins regularly and only keep the ones that truly add value.
Absence of a CDN
A content delivery network (CDN) helps your website load faster for users worldwide. It stores copies of your site’s static content, such as images and CSS files, across multiple servers located in different regions. This means that users access your site from the nearest available server, reducing loading time. If your audience is global, using a CDN is one of the easiest ways to boost website performance.
Redirects
Redirects are useful for managing URLs and maintaining SEO, but too many can slow down your site. Each redirect adds an extra step before reaching the final page. While a few redirects won’t hurt, long redirect chains can significantly affect performance. Whenever possible, try to link directly to the final URL to maintain consistent page loading speed.
For WordPress users, the redirect manager feature in Yoast SEO Premium makes handling URL changes effortless and performance-friendly. You can pick from redirect types such as 301, 302, 307, 410, and 451 right from the dashboard. Since server-side redirects tend to load faster than PHP-based ones, Yoast lets you choose the type your stack supports, allowing you to avoid slow website causes and boost website performance.
A smarter analysis in Yoast SEO Premium
Yoast SEO Premium has a smart content analysis that helps you take your content to the next level!
How to measure page speed and diagnose performance issues
Before you can improve your website performance, you need to know how well (or poorly) your pages are performing. Measuring your page speed helps you identify what’s slowing down your website and provides a direction for optimization.
What is page speed, really?
Page speed refers to how quickly your website’s content loads and becomes usable. But it’s not as simple as saying, ‘My website loads in 4 seconds.’ Think of it as how fast a visitor can start interacting with your site.
A page might appear to load quickly, but still feel slow if buttons, videos, or images take time to respond. That’s why website performance isn’t defined by one single metric — it’s about the overall user experience.
Did you know?
There is a difference between page speed and site speed. Page speed measures how fast a single page loads, while site speed reflects your website’s overall performance. Since every page behaves differently, measuring site speed is a more challenging task. Simply put, if most pages on your website perform well in terms of Core Web Vitals, it is considered fast.
Core metrics that define website performance
Core Web Vitals are Google’s standard for evaluating how real users experience your website. These metrics focus on the three most important aspects of page experience: loading performance, interactivity, and visual stability. Improving them helps both your search visibility and your user satisfaction.
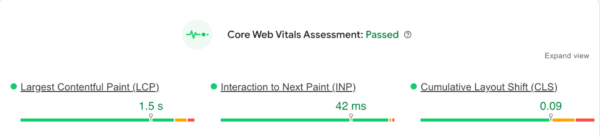
- Largest Contentful Paint (LCP): Measures how long it takes for the main content on your page to load. Aim for LCP within 2.5 seconds for a smooth loading experience
- Interaction to Next Paint (INP): Replaces the older First Input Delay metric and measures how quickly your site responds to user interactions like taps, clicks, or key presses. An INP score under 200 milliseconds ensures your site feels responsive and intuitive
- Cumulative Layout Shift (CLS): Tracks how stable your content remains while loading. Elements shifting on screen can frustrate users, so keep CLS below 0.1 for a stable visual experience
How to interpret and improve your scores
Perfection is not the target. Progress and user comfort are what count. If you notice issues in your Core Web Vitals report, here are some practical steps:
- If your LCP is slow: Compress images, serve modern formats like WebP, use lazy loading, or upgrade hosting to reduce load times
- If your INP score is high: Reduce heavy JavaScript execution, minimize unused scripts, and avoid main thread blocking
- If your CLS score is poor: Set defined width and height for images, videos, and ad containers so the layout does not jump around while loading
- If your TTFB is high: Time to First Byte is not a Core Web Vital, but it still impacts loading speed. Improve server performance, use caching, and consider a CDN
Remember that even small improvements create a noticeable difference. Faster load times, stable layouts, and quicker interactions directly contribute to a smoother experience that users appreciate and search engines reward.
Tools to measure and analyze your website’s performance
Here are some powerful tools that help you measure, analyze, and improve your page loading speed:
Google PageSpeed Insights
Google PageSpeed Insights is a free tool from Google that provides both lab data (simulated results) and field data (real-world user experiences). It evaluates your page’s Core Web Vitals, highlights problem areas, and even offers suggestions under ‘Opportunities’ to improve load times.
Google Search Console (Page Experience Report)
The ‘Page Experience’ section gives you an overview of how your URLs perform for both mobile and desktop users. It groups URLs that fail Core Web Vitals, helping you identify whether you need to improve LCP, FID, or CLS scores.
Lighthouse (in Chrome DevTools)
Lighthouse is a built-in auditing tool in Chrome that measures page speed, accessibility, SEO, and best practices. It’s great for developers who want deeper insights into what’s affecting site performance.
WebPageTest
WebPage Test lets you test how your website performs across various networks, locations, and devices. Its ‘waterfall’ view shows exactly when each asset on your site loads, perfect for spotting slow resources or scripts that delay rendering.
Chrome Developer Tools (Network tab)
If you’re hands-on, Chrome DevTools is your real-time lab. Open your site, press F12, and monitor how each resource loads. It’s perfect for debugging and understanding what’s happening behind the scenes.
A quick checklist for diagnosing performance issues
Use this checklist whenever you’re analyzing your website performance:
- Run your URL through PageSpeed Insights for Core Web Vitals data
- Check your Page Experience report in Google Search Console
- Use Lighthouse for a detailed technical audit
- Review your WebPageTest waterfall to spot bottlenecks
- Monitor your server performance (ask your host or use plugins like Query Monitor)
- Re-test after every major update or plugin installation
Speed up, but with purpose
As Mahatma Gandhi once said, ‘There is more to life than increasing its speed.’ The same goes for your website. While optimizing speed is vital for better engagement, search rankings, and conversions, it is equally important to focus on creating an experience that feels effortless and meaningful to your visitors. A truly high-performing website strikes a balance between speed, usability, accessibility, and user intent.
When your pages load quickly, your content reads clearly, and your navigation feels intuitive, you create more than just a fast site; you create a space where visitors want to stay, explore, and connect.
