Facebook Page Insights explained
This post is about all the information that can be found in Facebook Page Insights, and what we feel does and doesn’t make sense to look at for most of our visitors. It all depends on the kind of website you have, of course.
If you want to learn more about using social media and other essential SEO skills, you should check out our All-Around SEO training! It doesn’t just tell you about SEO: it’ll help you put these skills into practice!
Why you should check your Facebook stats
During a local networking event I recently visited, someone asked me what Facebook does for your sites rankings. Good question, especially since Facebook blocks a large number of posts for Google (you have to log in to visit most stuff, right). Except for public posts, that is – these obviously are indexed by Google.
Google does notice the number of links coming from Facebook to your website. The thing is, that when people talk about you on social media, you must be important for a certain topic, or one of your pages should be. If a page gets a lot of links to it, even from pages Google can’t read, Google can read that page on your website. And rank you for the subject of that page. There are more factors that should be taken into account, but this is the short version. Add that to the fact that Facebook search is getting better and better, as Joost explained a few weeks back, and you’ll have enough reasons to dig a little deeper in your Facebook reach and engagement. Facebook Page Insights helps you do this.
Assumptions
- Get 30 likes
You won’t be able to access Facebook Page Insights if your page has less than 30 likes. An easy way to increase this for new pages is to buy promotion from Facebook. But usually, 30 likes is something that can be achieved quite fast by just asking people to like your page. A couple of hours after getting that 30th like, Facebook Page Insights will be available at the top of your Facebook Page. - Historic data
Please note that Facebook stores information about your visitors for 180 days. If you want to keep track of historic data, be sure to export it now and then via the export function in the main Insights menu at the top of your stats. - Time zone
Pacific Time Zone is used to calculate the data for Page Insights, so be sure to translate times to your own timezone if needed. I use Google for that. - Glossary
I’ve added a very small dictionary at the bottom of this post for terms specifically used by Facebook, like reach and engagement.
Facebook Page Insights
I’d suggest opening it in a second tab or browser window, so you can check all the things mentioned below for your own page.
Facebook Page Insights provides you with loads of information about your visitors. The convenient thing with Facebook is that we all voluntarily enter all kinds of details about ourselves, knowing Facebook will use this to target ads and more. This information is pretty valuable for you as a Facebook Page owner as well. Facebook Page Insights will tell you for instance which posts had the most engagement from your fans, and what times your audience is on Facebook.
Page Insights Dashboard
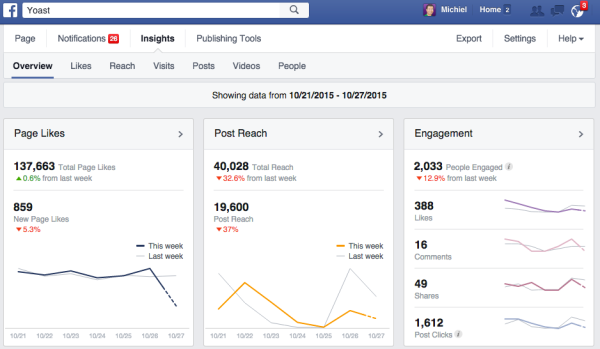
When you click Insights at the top of your Facebook Page, you’ll see something similar. It was a bad week for us, or so it seems. You should always keep in mind that this is just one week, compared to the week before. We launched Yoast Academy’s all-around SEO training on October 12 2015, so it makes sense that the week after that would have a little less reach or engagement.
Below the dashboard there is a nice overview of your last 5 posts. I’m a sucker for trends, not incidents, and that is why I hardly use this overview, but if you are in the middle of a campaign, this will provide quick information:
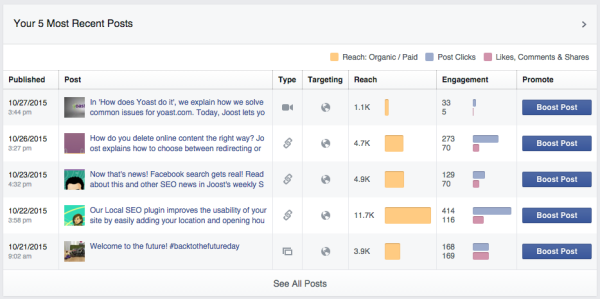
This is a nice, clean overview. It tells you:
- the post type (e.g. video, link or image);
- if you are targeting a specific audience;
- the post reach;
- the engagement (clicks, likes).
As with Twitter Analytics, I think the good stuff can be found on deeper levels in Facebook Page Insights. So let’s go to the first section: Likes!
Likes
The Totals graph is interesting, as it will tell you if your fan base has grown or not. Facebook Page Insights tells you about the likes you’ve gained, but also about the likes you lost. That can be due to people not liking your page anymore, or Facebook cleaning up their database. Facebook requires members to be human, that is why we always recommend creating a Page for your business, not a Profile (personal). Facebook is pretty strict about this.
It will also tell you the number of paid likes you received. I can recommend using Facebook ads / promoted posts on Facebook. It works. It’s as simple as that. As Facebook knows a lot about you all, and Facebook ads can be targeted right into your target audience, which can be adjusted per promotion. This will not only help you grow your likes, but it will also increase your reach for the next post!
Following the Total graphs, Facebook also tells you about where your likes come from. On a per day basis, you can tell what number of likes came from:
- ads;
- page suggestions (the People also like section);
- on your page, or
- page likes themselves.
Clicking a certain day in the graph will give you a nice pop-up with numbers as well. And a lot can be filtered by clicking the legenda next to the graph, or by adjusting the date range at the top of the page.
Reach
In the reach section, we find similar graphs and numbers. Where likes is about the click itself, reach is about the number of people that might have seen your post. Might have, as opening a page with your post below the fold and no scroll action, still seems to count as a view.
The section is about post reach and engagement and there is one extra interesting graph: an overview of Hide, Report as Spam, and Unlikes actions. Why is that interesting? Because it can tell you what post triggered people to ‘move’ away from your page. Let me show you an example:
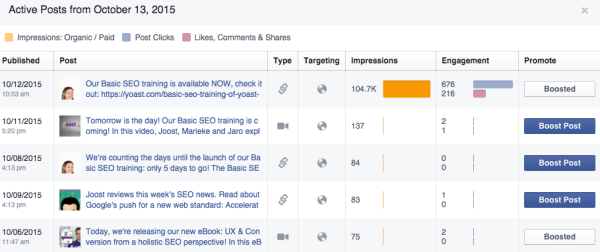
We boosted our Basic SEO training post and that triggered a lot of impressions and engagement. It also caused an increase in the number of posts that were hidden from timelines:
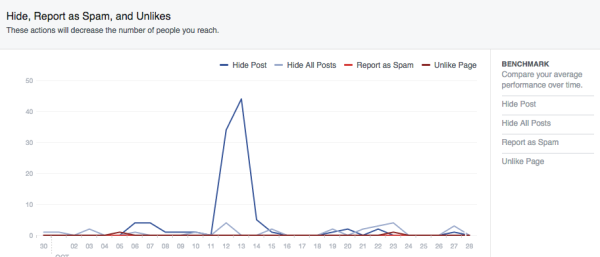
Makes sense, right? Luckily, this might have caused just one person to unlike our page ;) If you post once per day, this will give you a nice overview of what type of posts to avoid or adjust to your audience. If your promoted post gets hidden, that doesn’t matter as much as a sudden increase in ‘dislikes’, of course. Promoted posts tend to surface quite often, and I might have hidden a few of your own promoted posts as well. No hard feelings.
Visits
The Visits section will tell you what tabs on your Page have been visited the most. That can be your timeline, the info tab or the videos tab, for instance. Most of the times it’s your timeline. But it’s nice (and probably not more than that) to see that other tabs are visited as well. Make sure there is sufficient content or information on these tabs for just that reason.
The second graph in this section could be more interesting to you. It tells you the referrals to your Facebook Page. For us, that graph just shows that most of our Facebook visitors are coming from our website. Nice to know. It becomes interesting when other websites besides your own and Google start to surface in this graph. Monitor it from time to time. This is data you won’t find in Google Analytics.
Posts
This is my favorite section, to be honest. The post section is about your content. Not just about what content, by the way. It starts with a nice overview of visits per hour:
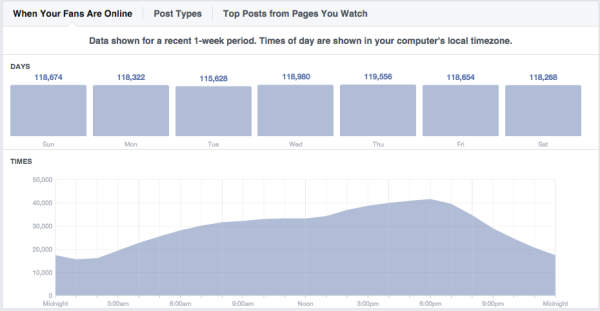
Remember what I said about timezones; this is Pacific Time. For us, that means posting on Facebook around 2PM would be smack in the middle of our peak hour.
Of course, this page will also give you valuable numbers on impressions per post and engagement per post. Use this to analyze what (type of) posts work best for your company:
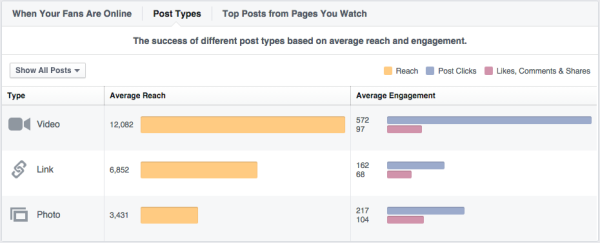
Video post (you might have seen a few of these) like our weekly recaps, get roughly 2.5 times the clicks of link posts, with only twice the reach. That’s interesting and the reason we focus a lot more on video now.
Facebook Page Insights provides some more insights on that, by the way. If you go to Insights › Posts › All posts published › click the video post you want to check › Post details › Video, you’ll find this:
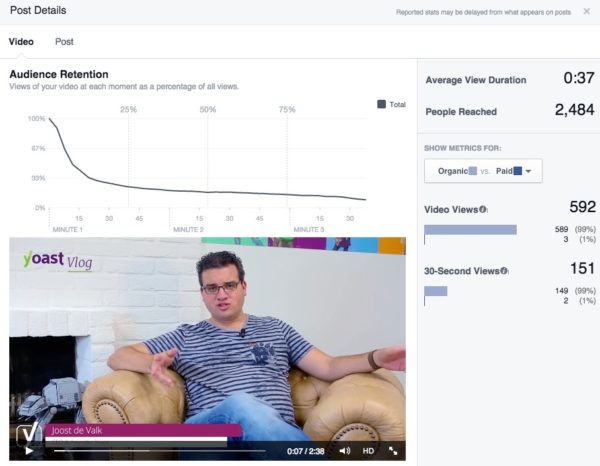
No, we are not going to make 37-second videos :) How many times have you started a video in your timeline, for instance on your phone, just because you were trying to scroll? Take that into account when checking these stats. But it is nice to know the reach of a video.
People
There is one tab remaining: People. Facebook shows you some stats here about gender and age of three groups of people:
- Your fans
- People Reached
- People Engaged
It’s a nice overview:
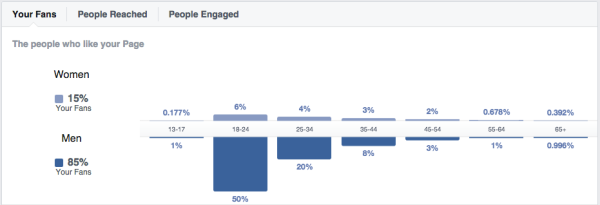
This could lead to the conclusion that it would be alright to use more popular language or tone on Facebook, for instance. The majority of likes comes from Men, 18-34 yo (70%). You should really check the other tabs here as well. The second tab tells a different story:
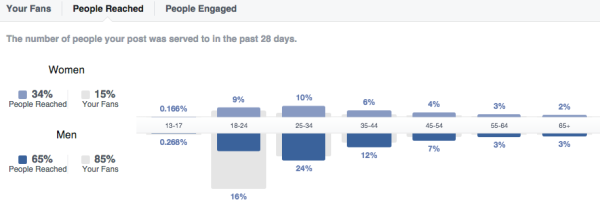
The main group here is Men, 18-44 yo and a number of women as well. FYI, the third group of people that actually engaged roughly aligns with this second graph. It shows you should really check all stats before jumping to a conclusion.
Next to age and gender, this section also shows country, city and language. Keep in mind that age and gender are found in our personal profiles, but country and city are derived from our IP addresses (might not be 100% accurate). Language is based upon the language settings you use for Facebook. Mine are set to English, but I’m actually Dutch. Check your settings here.
Final thought: 100 likes
In this post, I tried to go over all the things Facebook Page Insights can tell you. There is one more thing: competitor information. If your Facebook Page reaches the 100 likes milestone (as Facebook calls this), you will be able to add competitor pages to your Facebook Page Insights as well:
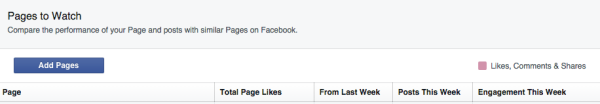
You can see details on their top posts, for instance, and things like number of likes and posts in that week. It’s always interesting to see what works for them, right?
Yes, they will get a notification that someone is watching their page, but not who watches it. So feel free to check the competition :)
You might also want to read:
Dictionary
- Post Reach: the number of people who have seen your post in the last 7 days
- Total Reach: the number of people that have seen any content related to your page (including ads, for instance) in the last 7 days
- Engagement: the number of people that “clicked, liked, commented on or shared” your Facebook post in the last 7 days. Engagement rate is the percentage of your viewers that engaged
- Post Clicks: total for the engagement actions
- Page Likes: total number of unique people liking your page
- Fans: equals likes
- Impression: a single view of your post shown in a news feed / timeline
Great article sir,
I was looking for it. My facebook page is heading towards 100 likes. Hope it will reach there so that I can add competitor pages to myFacebook Page Insights. And you are toatally right sir, it will surely help to know what works for them.
Thank you for sharing.
I have the same question as the poster above, Billy. Can we get some clarification about the actual timezone? Is it Pacific Time or local timezone ?
See above.
Nice post. It is good information to help sort through all of that data.
Question- You mentioned a few times about the timezones, especially in the ‘Posts’ section, and how the stats are in Pacific Time.
However, it says on the insights page…and even your screen shot…that “The times of day are shown in your computer’s local timezone.”
Can we get some clarification on which is actually right? Thanks :)
Very good point. Facebook mentions this over and over, so I felt the need to include that in the assumptions. I might have been more specific about this and have changed the assumption accordingly: “Pacific Time Zone is used to calculate the data for Page Insights.”
Great article. Page insights are great but you should do one on Audience Insights. I think there’s much more there to learn about. Thanks
Thanks for the suggestion, Dale!
I have not been able to see any of this for over 12 months. When I click to view in sights all I get is the little circle going around. But I get the weekly email.
Does anyone have any idea why this is happening?
Sounds like a connection issue rather than anything else, imho
What about check-ins? I am part of a Causely community that monitors check-ins but it always seems to log many more check-ins than I see in my dashboard.
Could you elaborate a bit on that, Jim – interesting.
Hi guys!
Did you see that when you export your publications data, the excel files gives you 1000’s of data that it’s not in the web version?
It’s hard to learn how to get the most of this data… it would be nice if you can help us to understand how to get valuable insights.
Greetings from Uruguay.
I think that all depends on what you’d like to learn from that data, right? The web version seems to show the top / recent data per subject; for a lot of (f.i. small business) companies that’s enough to know.