What is Cohort Analysis in Google Analytics?

You might’ve noticed some features in beta under the Audience tab. One of those beta features is Cohort Analysis. I started looking at this analysis because I was curious. As is often the case with Google Analytics, it wasn’t evident right away. So that’s why I thought I’d delve into it a bit more and try to explain what this does for you!
What’s a cohort?
Before I can decently explain what Google Analytics’ cohort analysis is about, it’s probably a smart idea to explain what a cohort is. When asking Google what the meaning of ‘cohort’ is, it gives me this explanation:
In this case, the second definition is, of course, the one we’re looking for. A cohort is any group of people sharing a characteristic. I think one of the most heard cohorts these days is the ‘Millennials’ cohort. In Google Analytics’ case, the only characteristic to be shared you can select, at the moment, is Acquisition Date.
Cohort analysis
So a cohort analysis is the analysis of a group of people. In this case, people who interacted with your website at the same date or date range. When clicking Cohort Analysis in Google Analytics, it’ll look something like this:
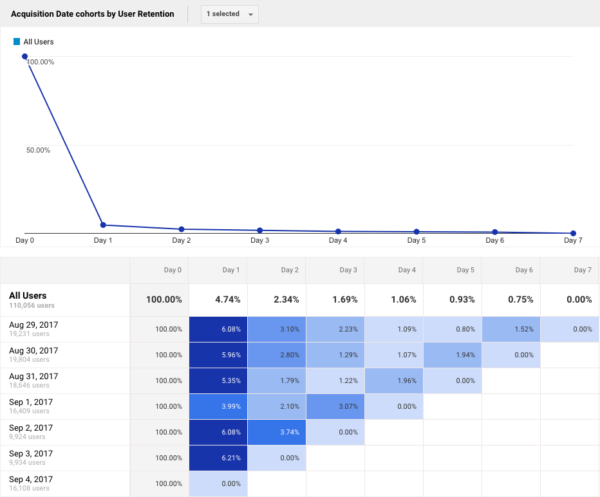
I don’t know about you, but this isn’t immediately clear to me, so let me walk you through how to look at it. The chart at the top is a visualization of the average user retention (percentage of returning visitors) for the date range, which is seven days by default.
The most interesting, however, is the table below the chart. This gives us insight into what percentage of people returned to your site within seven days of visiting it for the first time. Day 0 corresponds with the date in the first column. Day 1 is the first day after someone visited your website for the first time. So the 6.08% at Day 1 in the August 29 row means that 6.08% of the people who visited example.com for the first time on August 29, visited example.com again on the next day (August 30). Day 2 is the second day (August 31) and so on.
Note: this is a breakdown of New Users, so although it says “All Sessions,” this only includes people having visited your site for the first time.
What can I do with cohort analysis?
This is a question that I immediately asked myself. It wasn’t clear to me right away, so I might be a bit slow, or it’s not that obvious. I’ll let you be the judge of that ;)
Let me give you an example (not yoast.com, by the way):
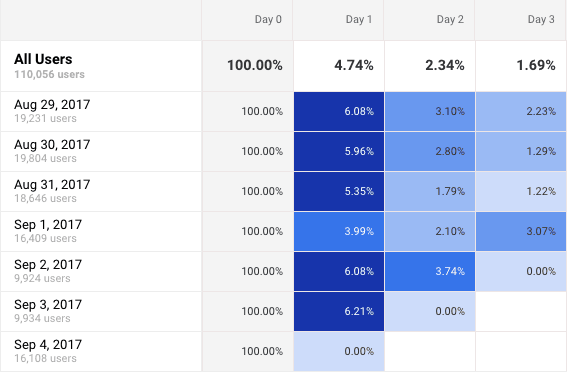
So what happened on September 1 that made fewer people who visited this website for the first time on September 1 visit again the next day? The retention rate is about 2% lower there. Maybe they had a campaign gone wrong? Were they facing some technical issues with the website? Or perhaps they publish a post every day except for this day? This can be a great way of figuring out whether what you’re trying (new content, new campaigns, etc.) is working.
Breaking down the cohort
If you need a more precise look at what’s happening, either because you don’t know why the retention rate was lower/higher, or because you’re a data geek, you’re in luck. You can actually ‘break down’ your cohort analysis by using segments. For instance, if I were to use the Mobile and Tablet Traffic segment on the data above:
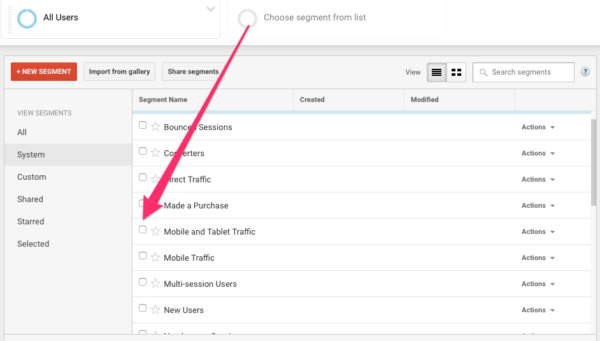
Google Analytics will give me this cohort report:
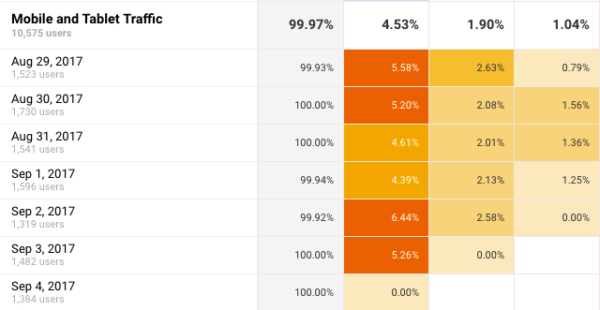
This shows the data for people who not only visited your website for the first time in the set time frame but were also on a smartphone or tablet when viewing the site. You can have up to four of such segments active at the same time. This way you can see whether the (expected) effect happened for all sorts of people, such as people on mobile phones, people from search engines or direct visitors, etc.
Other metrics
You can select quite a few metrics that will make the cohort analysis useful for a lot more than returning visitors:
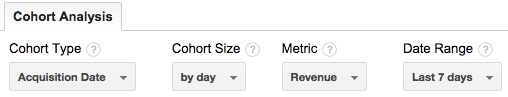
Although the Cohort Type has a dropdown, it has the one option. The Cohort Size can be set to ‘by day,’ ‘by week’ or ‘by month’ and the Date Range will change accordingly. The most interesting though is the Metric drop-down. You can select a lot of per user metrics (revenue, pageviews, transactions, etc.) or total metrics (again revenue, pageviews, etc.) apart from the Retention metric I used in the examples above.
This way you can see a lot of effects, such as whether your overall revenue or revenue per user has increased after a post or campaign. Of course, you can see your sales or revenue increase if you have a successful campaign, but this data is different.
You can now see how much revenue you got from people that visited your website for the first time on a particular date and see if these new visitors bought something on that date or in the days to follow. And since you can see this for an entire date-range, you’ll also be able to see if that’s a higher or lower revenue than was to be expected.
Example of a cohort analysis
Let me give you an example. Say you changed your landing page recently, which you tailored to convince new visitors of your site to buy a product. You could look at the revenue from new visitors and see if it increases. However, if a visitor were to visit your website for the first time, only to return the next day to buy your product, Google Analytics wouldn’t show it as a new visitor anymore. That’s why these cohorts work: the visitor was new at the set date, so even if they buy the product a day (or two, or more) later, they’ll still show up in the cohort analysis. So you’re not only measuring direct effect anymore, you measure delayed effects as well!
By the way, to be sure you have only the visitors that visited that landing page, you could create a segment for visitors who visited that page.
The downsides
While looking at the cohort analysis for yoast.com, I noticed that the Retention metric is quite difficult for our domain. Our traffic, even from the new visitors, is very stable. The pattern was the same all the time, no matter what date-range I selected. This is because we have such a steady flow of new visitors, any lift here would only be a small change in percentage.
So, the changes in the percentages are too small; if everything between 3.5% and 4.5% is the same color, it’s pretty hard to distinguish any real differences. Of course, I could look at the percentages, but that’s not as convenient.
More importantly, though, we can only create cohorts based on Acquisition Date. That’s nice, but I do hope they’ll start adding more Cohort Types. But this feature has been in beta for a very long time so I’m wondering if they are still working on it. The Acquisition Date is not enough, for me at least. I’d love to see cohorts of people buying a particular product (category), for instance.
Summing up
The cohort analysis can give you some insights that weren’t readily available before. However, it does still require more than a basic knowledge of Google Analytics and might be a little confusing in the beginning. So I’m not entirely sold on this feature yet, but to be fair; it’s in beta for a while now, so who knows how much better it will get right?
Did you think of any other cool ways of using the cohort analysis feature? Or do you think I said something utterly stupid in this post? Let me know!
You might’ve noticed some features in beta under the Audience tab. One of those beta features is Cohort Analysis. I started looking at this analysis because I was curious. As is often the case with Google Analytics, it wasn’t really clear right away. So that’s why I thought I’d delve into it a bit more and try to explain what this actually does for you!
Read more: Why every website needs Yoast SEO »

I’ve never used it before. Thanks for the insights