3 exercises to have more fun with Google Analytics

This post is for those of you who want to use Google Analytics, but feel a threshold to start with this tool. For everyone that wants to see the fun of Google Analytics, but is having a hard time finding that fun. This is a post for people that are scared to use Google Analytics because they’re afraid to break something. This is a post I needed when I started with Google Analytics.
Google Analytics’ Danger zone
If you’re afraid of skewing data, removing data, or harming data, if you will, then the following should release you from that stress: as long as you are in the reporting section of Google Analytics, nothing bad can happen.
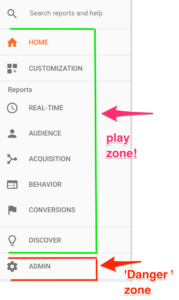 The Admin section is the place where you can do real damage. Here, you can add filters that could harm your data if not used right, here you can adjust time zones. In other words: the Admin section is the place where you implement changes that affect your data.
You can’t adjust the actual data in the reporting section. You can only adjust how you’re seeing your data, the section of data you want to see, but underneath it all, the data stays the same. So, the reporting section is for everyone, even for people who don’t have a clue what the heck they’re looking at.
Reporting section aka play zone
Know what you’re looking at
If you can’t harm your data when in the reporting section, this means you’re in a playground where you can do anything you like and just play with what you’re seeing. Of course, it helps if you have a little context. Knowledge about what you’re seeing. Luckily, Google offers a lot of information about how to handle Google Analytics. These pieces of information are in Google Analytics, you just need to know where to find them.
Every dimension and metric in Google Analytics is accompanied by a question mark that explains what you’re looking at:
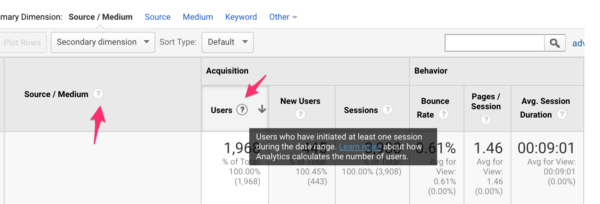
I really like this feature because it gives you so much more context. And if the explanation is too vague or complex, Google it. There’s always someone that can explain it better on the world wide web.
There’s also a section in Google Analytics called ‘Intelligence’ that’s set to guide you through Google Analytics by asking you questions (and showing you some answers) and notifying you about anomalies in your data:
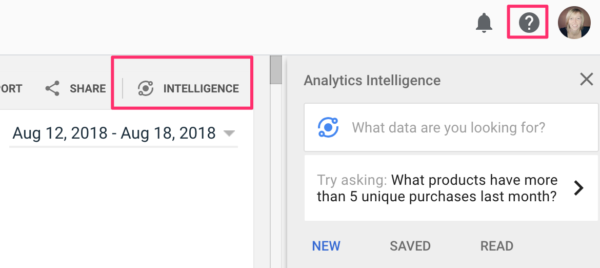
And at the top of the page is a question mark where you can ask for help. Especially the ‘Intelligence’ section is a nice starting point for your Google Analytics journey.
Let’s play!!
I want to share some very basic exercises with you that made me realize Google Analytics is a fun tool to play with. If you understand how the following exercises work, and the opportunities they’ll give you, then you can find the joy and insights you’re looking for.
Exercise number 1: use the search bar
There are a couple of search functions in Google Analytics. One that helps you with how to use Google Analytics or helps with navigating quickly to your destination.
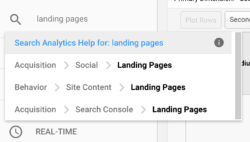
But that’s not the one we’ll be using for this exercise. I’m referring to the search bar in the data table. This lets you search in the first column of the table. Here’s the assignment:
- Go to the ‘Acquisition’ section
- Click on the ‘Source/Medium’ report from the ‘All traffic’ dropdown
- Enter in the search bar “organic”
- What do you see?
This is very awesome if you need to find very specific information, or want to see totals of a category or a group of data. Like in this case, the group ‘organic’. Or, if you want to check a specific page or just pages that have /category/ in common for example, the search bar comes in really handy. And it saves you a lot of time scrolling.
Of course, there are other ways to see just your organic traffic, but this post is meant to be simple, so I’m keeping it simple. Or at least, I hope you don’t find it too hard.
Exercise number 2: add a secondary dimension
Context is not just the SEO word of 2018, it’s vital for doing a proper analysis. Adding a secondary dimension gives you more context because it adds more information to the data you’re seeing. Without proper context, you might draw the wrong conclusions. So, follow these steps to add more context to your report:
- Go to the ‘Behavior’ section
- Click on ‘Landing Pages’ from the ‘Site Content’ dropdown
- Click on ‘Secondary dimension’
- Select ‘Source’ in the dropdown
- What do you see?
Now, this is awesome, you can check per source where people land on. Go over all metrics, hovering over the question marks to understand what you’re seeing. Can you see differences per landing page, per source? And what does that tell you?
Exercise number 3: use a segment
This challenge lets you specify things even further, giving the report even more context. In Google Analytics, you can add segments and this enables you to see just a specific piece of data. I absolutely love segments because, for me, they make the data I’m seeing much more understandable and less abracadabra.
- Stick to your current report
- Scroll all the way up and click on ‘+ Add Segment’
- Search for the ‘Organic Traffic’ segment
- Hit ‘Apply’
- Remove the ‘All Users’ segment by clicking on the downward arrow
- What do you see?
So, what do you see? How does this relate to SEO? You’re seeing pages people land on who are coming from a search engine. What’s the most popular search engine? And are the pages you’re seeing, pages you want to rank with? So much information about SEO in Google Analytics right here! Very cool right?
Conclusion
Google Analytics can be scary, especially if you’re afraid you might break something. But if you stay in the reporting section, everything you do is for your eyes only. After doing the exercises in this post, I invite you to just click around. Click on everything that’s clickable and try to understand what you’re seeing after that. If you do that, Google Analytics is far more easy to digest. And, hopefully, more fun, too. Good luck!
Read more: Tracking your SEO with Google Analytics »

Can you make an article how to connect woocommerce store with analytics properly? I set some things but I’m not sure if they are correctly collecting data about conversion or if everything set as it should.
I love practical exercises. Thanks.
By the way, I’m not sure if everyone knows but Google offers free Analytics courses. They’re really good.
This information regarding google search console is very helpful for me at least. I can do a lot of stuff now. Thanks for telling this.
As this article is specifically designed for beginners may I suggest that instructions such as “go to xxxx” contain a link to the suggested destination?
eg.
“But that’s not the one we’ll be using for this exercise. I’m referring to the search bar in the data table. This lets you search in the first column of the table. Here’s the assignment:
Go to the ‘Acquisition’ section” <- Link to Acquisition section needed.
I for one have no idea where the ‘Acquisition’ section is.
Agreed a link might be helpful, but just FYI, “Acquisition” is one of the links displayed in the “play zone” image at the top of the post. It’s a reporting category.
Thank you for sharing, it can be intimidating, just as the Webmaster Tools used to be, but they too have a new “search console” interface. Maybe Google is getting more user friendly?
Thanks Annelieke :-)