The beginner’s guide to SEO reporting

When you work on your site’s SEO, reflecting on those efforts should be part of your ongoing strategy. Whether it’s for a client, your manager, or your team, creating an SEO report is the best way to do so. This helps you justify your efforts, keep track of performance and figure out what needs to be tackled next. And it’s not as hard as you would think. In this blog post, we’ll explain what SEO reporting is and take you through the process step by step.
Search engine optimization (SEO) helps drive more traffic to your site and improve your brand image. It should be part of anyone’s marketing strategy whose goal is to grow their (online) audience. Originally focused on performance in organic search, SEO now entails much more than that. It helps you build a strong brand name, become an authority in your field, and be visible on the platforms where your audience can be found. All this is to increase customer loyalty and grow your business.
What is SEO reporting exactly?
SEO reporting is best described as evaluating your online marketing efforts and presenting the outcomes in a report. This can be a report you create for yourself, your team, management, or a client. Often, a company has a specific template they use to do SEO reporting regularly (for example, every month). This can be in the form of a slide deck, online document, Excel sheet, or online dashboard. But it can also be any other reporting tool you feel comfortable with or your company uses for presentations.
In an SEO report, you will find metrics related to a website’s performance and other marketing activities related to SEO. This helps you track how your SEO strategy is performing and where tweaks are needed. That’s why an important part of any SEO report is the interpretation of metrics and conclusions that come out of that.
What to include in your SEO report
Whether you’re creating an SEO report for internal use, or for your client(s), it’s good to have a template. This allows you to compare recent findings with earlier ones, regardless of the frequency with which you’ll be reporting. Of course, you can make changes to this template along the way. But having a template saves you time and helps you recognize bigger issues and opportunities over time.
Naturally, it depends on your business goals what should be in your SEO report. The most important thing is that your SEO report reflects your (or your client’s) goals. This is to understand how your marketing efforts are contributing to reaching these goals and what actions need to be taken. But there are a few basics that most of us will want to include.
If you’re not building a full report just yet, you can check the performance of your pages with our SEO analyzer tool, and you can also easily download a report with the issues and recommendations on how to fix them.
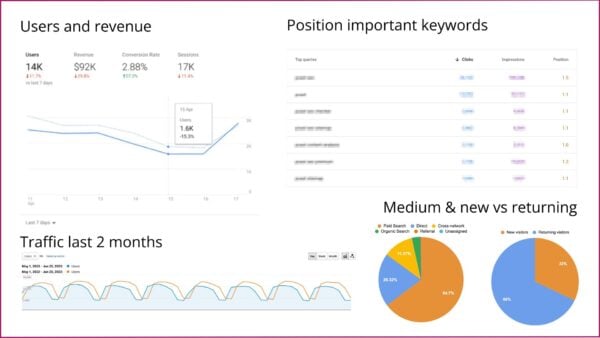
A general data overview
Start with an overview of the most important data for your business or website. This gives you an idea of how you’re doing right away. Especially when you’re reporting regularly, this overview will tell you or your client how the website (and online business) is performing. You can also choose to include data from the previous period (or the previous year) for comparison.
Website data to include:
- The number of site visitors
- Number of purchases (or other actions you want people to take)
- A visualization of your traffic over the selected period
- Keyword rankings for a few important pages
- A traffic overview by source or medium
- The type of visitors (new or returning)
Data on (content) performance
The general overview gives a quick insight into the current state of play, but to figure out how you got there, you must go into more detail. That’s why your report should include a closer look at content performance. Make sure to include data on your most important pages, such as product pages, popular blog posts, or other landing pages that attract a lot of people.
Collect data such as page views, visitors, engagement, event count, revenue, and traffic sources. You don’t have to include everything, as this will be overwhelming and will probably cause people to lose interest. Look at the data of your most important pages, pick out the numbers that stand out (growth or decline) and add those to your report. It can be tempting to focus solely on the positive numbers but also include the negative ones to paint a realistic picture. This speaks to your credibility, makes it easier to spot issues before they get out of hand and helps the company in the long run.
Other elements to include here are an overview of new backlinks to the website, stats related to site health and the Core Web Vitals, and an overview of keyword rankings. But do remember that keyword rankings can change on a daily basis, and obsessing over individual drops in rankings isn’t going to help your overall SEO. Use these averages to get an idea of whether your overall rankings are dropping and what you can do to get your organic traffic back up again.
Activities previous period
When you have had a look at the data, it’s time to summarize what has gone out that month (or period of your choice). Use this section to highlight how many posts have gone out on social media, how the audience has interacted with those, what blog posts have been written or updated, and how your running ads are performing. But you can also include other online or offline marketing activities to show what has been done.
Where possible, you can tie this in with any peaks in traffic or engagement. Or it can help you explain why some areas have gotten less attention than others. Either way, use this to make sense of the data and to highlight the hard work that has been put in by the team.
A summary with recommendations
Always end your SEO report with specific action points that come out of that month’s evaluation. It helps to start with a summary of the ‘highs and lows’ that were brought up in the report so far. For example, if you have noticed a noticeable drop in rankings, and therefore organic traffic, to one of your most important pages, it will make sense to focus on getting to the bottom of that in the coming weeks. And making improvements based on your findings. Or if a new type of social media post did very well, another action point could be to create a series of those and see if you can keep this success going.
But this last part is also a moment of reflection on a bigger level. Are you still on track with the business goals, or any specific SEO goals you’ve set for yourself? And don’t forget to go through the action points you thought up in the previous SEO report. Were you able to get those done? Are a few of them still in progress? Or are there any blockers that you need help with? Make sure to end with an action plan for the upcoming month and a team (or client) that’s on board with everything discussed.
Creating an SEO report: step by step
Now that you know what to include, let’s talk about how to get started with your SEO reporting. Before you start pulling together the data, it’s important to set clear KPIs and create a setup that works for your company.
1. Set up your KPIs
The first step is to define KPIs, which stands for key performance indicators. These should be measurable goals, based on the marketing goals and/or business objectives within the company. To give a simple example, if one of the marketing goals is to grow traffic to your website, a corresponding KPI can be to increase your organic traffic by 10% that year. Other popular KPIs are conversion rate, overall rankings, click-through rates, bounce rate, page load time, and branded/non-branded traffic.
Make these KPIs realistic, especially when you’re setting expectations with a client, and reflect on the progress in your SEO reports to stay on track. I would suggest not focusing too much on maintaining certain rankings or data on specific pages. Rankings are heavily subjected to external factors and can change daily, and zooming in on one page too much can make you lose perspective. Of course, a drop in traffic for an important page is something to keep an eye on and can be a reason to make some adjustments. But keep the overall KPIs in mind and be aware of the bigger picture, while tweaking what’s needed without obsessing.
2. Set up the structure for your report
Choose a tool for your SEO reporting. This can be a presentation tool that your team often uses, an information-gathering tool such as Excel or an Analytics dashboard, or one that your client is familiar with. Just make sure that you can set it up yourself and make tweaks when needed.
Add the sections that we’ve discussed above: a general overview, data on performance, marketing activities, and a summary with recommendations. I would suggest looking at your KPIs to figure out exactly what you want to show in the general overview and data on performance section. So, if your main KPI is growing your conversion rate, make sure that you add the data on this KPI to the general overview.
Test drive your new report by filling in this month’s data (or whatever period of time you choose). See the next step on how to tackle this. But this will help you figure out if the setup works for you in its current form. Always tweak when needed, whether that’s right now or a few months along the line. This report should work for you, you shouldn’t be jumping through hoops to get it to make sense.
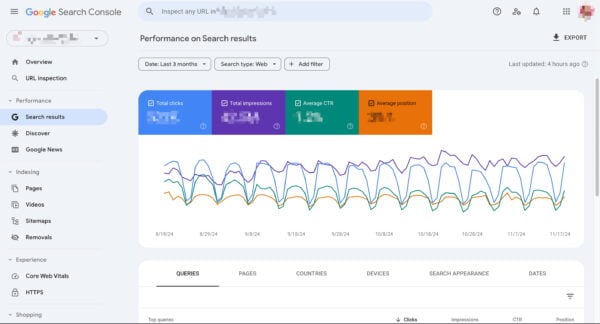
3. Gather and fill in the data
It’s time to start retrieving the data you need. There are a few tools you can use. For the general overview and data on performance, you can mainly rely on Google Analytics and Google Search Console. To get an easy overview of your marketing activities for that month, your own marketing calendar and the platforms that you posted on will give you the insights that are needed.
Data on website performance
For the general overview and data on performance, you can use Google Analytics and Search Console. Here you’ll find data such as visitor numbers, engagement, number of purchases (you will have to set this as an event), visualizations of your traffic, keyword rankings, traffic overview by source/medium, and type of visitors. Stats related to site health and your Core Web Vitals can also be found in Google Search Console. Lastly, if you want to get an overview of your backlinks, Semrush can provide you with that.
While you’re putting those numbers into your report, remember to be mindful of how you present them. Don’t just throw everything in there and overwhelm (yourself and) others with raw data. Highlight important data and make visualizations of certain data to break up the wall of text. You can also just copy and paste a few graphs and add those in. Using a graph to show overall traffic or a pie chart to show traffic by source/medium can already make a big difference.
Write down what speaks to you while filling in the data. What has been a success this month, and what are areas that need more attention? And if you see something that you can’t explain right away (f.e, a drop in traffic, or a post that has an enormous amount of views), try to figure out what happened there so you can answer questions that people will inevitably ask about it.
Yoast SEO Dashboard
To make your life a bit easier, you can also find a lot of the data needed in the Yoast SEO Dashboard. By showing important data from Google Analytics and Google Search Console, you get an easy overview of how your site is performing in search. Right in the backend of your site, without having to switch between different tools.
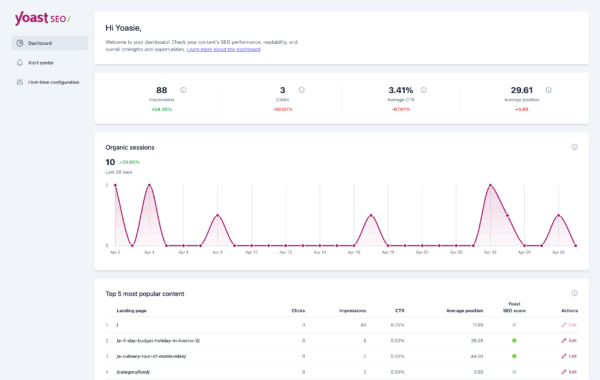
Get access to the Yoast SEO Dashboard!
See how your website and content is performing in one easy overview. Available in Yoast SEO free and Premium!
Disclaimer: Please note that we’re rolling out this new feature in phases. This means that you might not see the Site Kit integration in your Yoast SEO Dashboard yet. Eventually, this integration will be available to everyone using Yoast SEO.
Data on marketing activities
If you keep a marketing calendar, this is a great way to reflect on what you’ve published in the last month. Use this to summarize how many blog posts, social media posts, videos, newsletters and other marketing-related activities you’ve worked on. This includes other activities such as attending events, workshops, appearances you’ve made, or perhaps even print media.
When it comes to blog posts you’ve published, you could highlight one that stands out and use data from Analytics and Search Console to explain how it’s performing so far. Or you could just add the numbers up and give an idea of the overall effect of this content. Keep in mind that content needs some time to get noticed by people, so don’t fret if it hasn’t done that much yet.
Also, use this section to evaluate your social media posts and videos that you’ve uploaded to channels such as YouTube. I would recommend going to the platforms where you’ve posted content and using their analytics tools to see how well they’ve performed. This shows you what content works best and helps you draw conclusions from data from the source itself.
For other marketing activities that have happened that month, it really depends on the activity how to mention it in your report. If it’s an offline event or workshop, try to get some feedback from (potential) customers on their experience. When it comes to print media, you could try and get some idea of the effect by how many people have contacted you after seeing it. Just make sure to think about these things beforehand, to get an idea of the effect of these activities.
4. Evaluate and take action
When you’ve added the relevant data and summarized your marketing efforts, it’s time to properly evaluate. Go through your report and write down any patterns, issues, successes and opportunities. Add these to your overall summary and compare these findings to the ones you found last month (or the months before that) to recognize bigger issues and successes. This will allow you to properly evaluate your findings and turn them into actionable recommendations and action points.
When you’ve completed your SEO report and know what actions come out of it, it’s a good idea to present it internally. Or to your client. This helps them understand what you (and the team) have been working on and will probably spark a discussion that helps you figure out what to pick up first. Finally, after sharing this report with the relevant people and agreeing on next steps, make sure to plan these so they don’t get lost. Make a realistic plan for yourself or the team and pick up the action points to set everything in motion. And plan in the next SEO report to keep this cycle going!
Conclusion
Any good SEO report, whether this is for yourself or a client, starts with clear KPIs. Make sure to get those done before you start evaluating your SEO efforts. This will allow you to set up a proper template for the report and figure out what data you need to look at. Use the right tools to get the data you need, but don’t get lost in trying to report on everything. Show the relevant data and present this to the relevant parties to get everyone on board. Use all of this to figure out what your next steps are and follow up on the action points to make sure you keep focusing on the right things. Happy SEO reporting!
Read more: How to track website traffic: how many people are visiting your site? »
