Technology report in Google Analytics

The Audience data in Google Analytics beholds a lot of interesting data about your users. Not only does it provide you information about from which country they’re coming or the language they’re using, but it also gives insight in the device they’re using when visiting your site and the browser they’re using for doing that. And that my dear friends, is information you can use to make your site more accessible and user-friendly.
Technology report
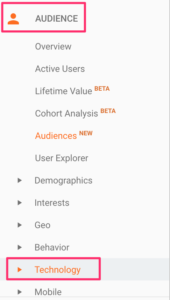
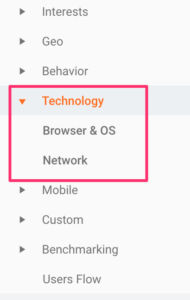
Information about the browser people are using to visit your website, can be found in the Technology report. Expand the Audience tab and scroll down:


The Technology report has some pretty cool features, let me show you:
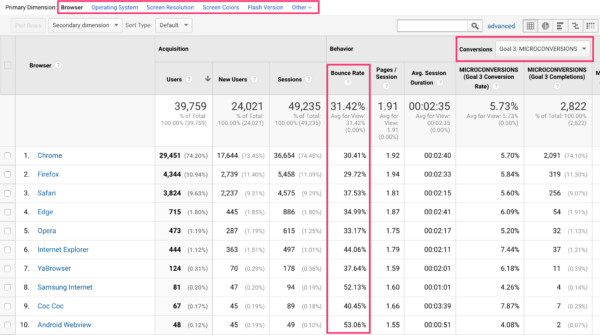
This is the default report you see when clicking on Technology. You can see the most popular browsers that are used for visiting your website. For this particular website, Chrome is by far the most important browser. But you can also check Operating System, Screen Resolution, Screen Colors, Flash Version and Java Support.
What does it tell you?
Browser
Of course, it’s interesting to know what your visitors are using for visiting your website, but that’s just information that’s ‘cool’ to know. But how can you use this data to optimize your website even further? Take a look at the report and see if you notice anything that’s a bit odd.
A higher bounce rate for a particular browser for instance. It may be an indication that your site looks different on a Safari browser than on a Chrome browser. Take a look at the Average Session Duration too, is there a browser with a very low session duration? Use that browser yourself and visit your website to see if you can understand why.
And if you have particular goals, like a contact form submit goal, you can check if there’s a browser performing poorly for that goal. It might just be that the contact form isn’t working properly for that browser. The same goes if you have an online shop, check the eCommerce stats and go over the report to check if you see anything unusual.
Keep in mind that you base your conclusions on a sufficient amount of data. But it won’t hurt testing your website across different browsers.
Operating System
You can do the same checks for Operating System. How does Windows perform on your site in comparison with Macintosh? Of course, it’s very well possible that people who are using Windows differ from people who use Macintosh. Do iPhone users convert better than Android users like discussed in this article? But again, it doesn’t hurt testing if your site works on your most popular Operating Systems. How awful would it be if your checkout doesn’t work on Android? Check the conversions for each of your goals, which Operating System is underperforming?
Screen resolution
When creating a new design for your website or deciding where your most important call-to-action should be, looking at screen resolution is a wise thing to do. You want to optimize for the vast majority of your visitors so check how your site looks on the most-used screen resolutions. Perhaps you’re always using an enormous monitor yourself when browsing while others might just be using laptops. Keep in mind that your site is for your users, take into account the screen resolution your visitors are using and take that as the basis for your design. How’s the font size? Can you see your call-to-action without scrolling?
Conclusion
To keep your site as optimized as possible, checking your Technology reports once in a while is a good idea. It can help you identify technical issues your site might have with particular browsers or browser versions and operating systems. If you’re planning to do a redesign, check if your redesign works on the most popular browsers, operating systems and screen resolutions. And if you’re using new software or plugins on your site, the Technology report gives great insight into whether or not everything works for your visitors.
Read more: Tracking your SEO with Google Analytics: a how to »


Thanks for the information, it is really a great information to help. This blog really cover all the details of seo and its result.
Well, this is good but… after GDPR (that enforce Cookie Law without any cookies before users accept), my Google Analytics is useless. No one user accept cookies, not even analytics cookies. I must use statistics of hosting provider to know at least the accesses. How do you believe google will adapt to this?
Great article. I would add the Resolution in the Technology Category of useful information that can be found within
Google Analytics. This is useful to choose the optimal resolution (not to big, neither too small) for images and website design elements in general, in order to keep a low website size while not affecting its quality.
Great addition Luca, thanks!
Thanks again, very well written, reading yoast seo blog become one of my hobbies lately. Your posts are very informative and cover all aspects of SEO.
Good introduction to a feature in GA most people don’t know about – thanks Annelieke :-)
Thanks Andy!
Unbelievable! Just when I thought I was already looking at all the data I needed it to, this post pops in my inbox. Great stuff!!!
I saw this part on Google Analytics and thought not necessary. now I know!
Glad to hear Sajjad :-)
I had not thought about Screen Resolution at all and Browsers were not on my radar so this is really valuable information. Honestly, can you believe it! Thank you for this!
Thanks Marjorie!!
Excellent info Annelieke, just what I was looking for!
Great post, what average bounce rate on device, browser or resolution may indicate problem?
Hi Milena, that really depends on the kind of page. Some pages are ok to have a higher bounce rate, others not! You can read all about that here: https://yoast.com/understanding-bounce-rate-google-analytics/ but in general you could say that if the bounces on a certain device are a lot higher, something might be going wrong on that device.
That’s great we get an insight of all the audience and get every particular detail about them. Moreover, the best part is that it helps optimize the whole website overcoming technical issues.