Some time ago, Google caused quite a stir by announcing a new ranking factor for 2021: page experience. User experience has always been an essential part of building the best site out there, but now, it will play an even bigger role in helping you build awesome sites for your customers. All this is powered by new metrics, with at the center: the Core Web Vitals. Time to meet LCP, FID, and CLS!
On April 19, 2021, Google announced that the Page Experience ranking factor will roll out gradually starting in Mid-June 2021.
The Google page experience update powered by Web Vitals
We’ve talked about this page experience update before, but we’d like to take another look at those Core Web Vitals. In general, site speed metrics tend to be hard to understand and confusing. Plus, they tend to change somewhat each time you test your site. You don’t always get the same scores. It’s easy to say that you have to look at some metrics hoping they turn green.
Of all the possible metrics, Google now identifies three so-called Core Web Vitals. These are the focal point for Google in the coming year. Every year, Google might add or change these metrics as they evaluate them over a longer time.
Core Web Vitals are the subset of Web Vitals that apply to all web pages, should be measured by all site owners, and will be surfaced across all Google tools. Each of the Core Web Vitals represents a distinct facet of the user experience, is measurable in the field, and reflects the real-world experience of a critical user-centric outcome.
For now, the three pillars of page experience are:
Loading performance (how fast does stuff appear on the screen?)
Responsiveness (how fast does the page react to user input?)
Visual stability (does stuff move around on the screen while loading?)
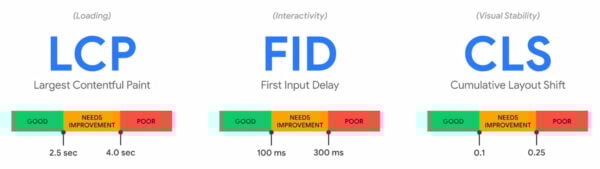
To measure these essential aspects of user experience, Google chose three corresponding metrics — aka the Core Web Vitals:
LCP, Largest Contentful Paint: This measures how long it takes for the largest piece of content to appear on the screen. This could be an image or a block of text. A good grade gives users the feeling that the site loads fast. A slow site can lead to frustration.
FID, or First Input Delay: This measures how long it takes for the site to react to the first interaction. This could be a tap on a button, for instance. A good grade here gives the user a sense that a site is quick to react to input and, therefore, responsive. Slow, again, leads to frustration.
CLS, or Cumulative Layout Shift: This measures the visual stability of your site. In other words, does stuff move around on the screen while it is loading — and how often does that happen? Nothing more frustrating than trying to click a button when a slow-loading ad appears in that spot.
The three Core Web Vitals and their scores
Google’s John Mueller has said that all three metrics must appear green if you want your site to get a ranking boost. Note, of course, you shouldn’t optimize your site to get green scores — but having green scores absolutely will be beneficial for your visitors. It’s all about happy visitors — and great content, of course!
Every page experience tool uses several Web Vitals gathered from a variety of sources. As every tool has a different purpose, the metrics used differ per tool. However, the common denominator is the Core Web Vitals, as Google uses these in every page experience tool it has.
But what do all these numbers mean? What do you have to look for on your site? And when is your site fast enough? When do I have a good grade? There are a million questions you could ask about these metrics. And while Google is trying to close the gap between understanding and improving, this continues to be a complex topic. Measuring site speed and user experience are hard — there are so many things to factor in.
What are these Core Web Vitals?
The Core Web Vitals don’t work in isolation, as there are many other metrics. Some are based on controlled lab tests, while others are metrics that only work with field data. After doing a lot of research, Google determined a new set called Web Vitals. These are a combination of metrics we already know, plus a set of new ones. The three Core Web Vitals are the most important ones, and Google is specifically asking site owners to keep an eye on these scores and improve them where they can.
LCP: Largest Contentful Paint
Largest Contentful Paint measures the point at which the largest content element appears on the screen. Keep in mind that it doesn’t measure the time it takes for your page to load fully, but it simply looks at when the most important part loads.
If you have a simple web page with just a piece of text and a large image, that large image will be considered the LCP. Since this is the largest piece of content to load in the browser, it’s destined to make an impression. By getting that to load quicker, your site can appear much faster. So, sometimes, it might just be as simple as optimizing that image itself.
In the past, there were metrics like First Meaningful Content, which measured the time when the first piece of content appeared on the screen that meant something to the user. Unlike the name suggests, the FMC metric often couldn’t figure out the most meaningful thing that appeared on the screen. Complex metrics lead to useless data.
Largest Contentful Paint is easy to understand: it is simply the time it takes for the largest element to appear on the screen. These elements might include images, videos, or other types of content.
What you need to know
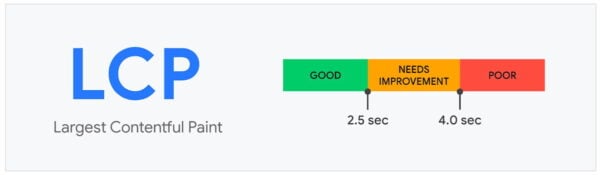
Now you know what the LCP is, you can start optimizing for it. According to Google, you should aim for the LCP to happen within the first 2.5 seconds of the page loading. Everything under 4 seconds needs improvement, and you can consider everything over that as performing poorly.
An overview of the scoring for LCP
The LCP is also dynamic, as the first thing that loads might not immediately be that large image. The LCP shifts to that large image when that appears on the screen.
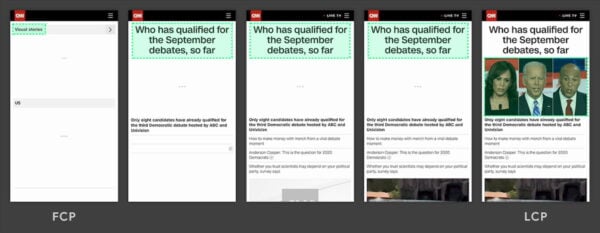
Here’s an image from Google that explains how the works:
This image from Google gives you a good idea of how the LCP is measured
On the left, you first see the logo and ‘Visual stories’ line appear. In the second screen, the large headline appears as a candidate for LCP. In the last screen, however, you see that a big image overtakes the header as LCP. If you have just one big piece of content, that might be the LCP the whole time.
If you look at the image’s loading process, you can easily see why this is such a handy metric. You can easily spot what the LCP is and optimize the loading of that element.
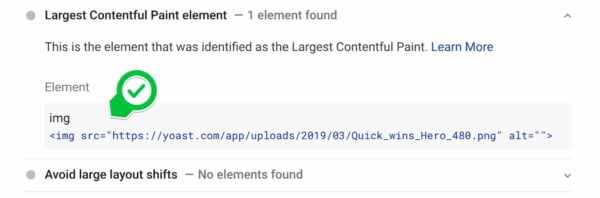
Google offers several tools to help you find all these elements. PageSpeed Insights, for instance, offers a wealth of data on Web Vitals, plus a whole lot of advice to improve your page. If we run yoast.com on PageSpeed Insights, we get several scores and advice below that score. In our case, the LCP was a large image. In the screenshot below, you can see that PageSpeed Insights correctly identified that element. Now you know what to improve!
PageSpeed Insights identifies the large header image as the LCP on on our site
According to Google, the LCP is affected by a number of factors:
Slow server response times: optimize your server, use a CDN, cache assets, et cetera.
Render-blocking JavaScript and CSS: so minify your CSS, defer non-critical CSS, and inline critical CSS.
Slow-loading resources: so optimize your images, preload resources, compress text files, et cetera.
Issues on client-side rendering: so minimize critical JavaScript, use server-side rendering and pre-rendering.
The First Input Delay measures the time it takes for the browser to respond to the user’s first interaction. The faster the browser reacts, the more responsive the page will appear. If you are looking to offer your users a positive experience — who isn’t? — then you should work on your pages’ responsiveness.
Delays happen when the browser is still doing other work in the background. So, it has loaded the page, and everything looks dandy. But when you tap that button, nothing happens! That’s a bad experience, and it leads to frustration. Even if there’s just a small delay, it might make your site feel sluggish and unresponsive.
A browser has to do a lot of work, and sometimes it needs to park certain requests, only to come back later to them. It can’t do everything all at once. As we’re building ever more complex sites — often powered by JavaScript — we’re asking a lot from browsers. To speed up the process between getting content on the screen and making it interactive, we need to focus on the FID.
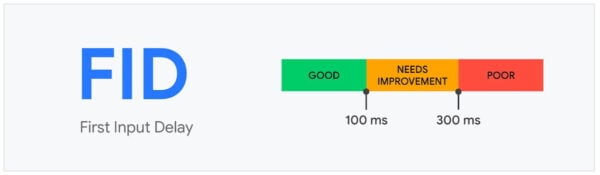
The FID measures all interactions that happen during the loading of the page. These are input actions like taps, clicks, and key presses, but not interactions like zooming and scrolling. Google’s new metrics call for an FID of less than 100ms to appear responsive. Anything between 100ms and 300ms needs improvement, and you can view anything above that as performing poorly.
After testing the FID you get a score and you can work from there
What you need to know
One of the things you need to remember is that you cannot measure the FID if there is no user interaction. This means that Google can’t simply predict the FID based on the data they have from the lab — they need data from real users or so-called field data. This also means that this data is less controllable than lab data as it collects data from users will all kinds of devices and who uses it in different ways and environments. This is one of the reasons why you sometimes see data change.
If you are looking to improve your scores, you will often find JavaScript to be the culprit of bad grades. JavaScript helps us build awesome interactions, but it can also lead to slow websites with complex code. Often, the browser cannot respond to input while it is executing JavaScript. If you improve your JavaScript code and its handling, you are automatically working on improving your page experience scores.
This is the hardest part, though. Most sites can gain a lot by reducing the time it takes to execute JavaScript, breaking up complex tasks, or removing unused JavaScript.
For instance, yoast.com has a pretty good score, but it’s not perfect. There are still processes that prohibit us from getting perfect scores. Some of these are complicated to fix, or we need this code for our site to function properly. You should look at your scores and determine what you can do. Try to find the improvements that are easiest to do or result in the biggest performance jumps.
There are always improvements to make, but you have to decide if that’s worth it — or even possible
The third Core Web Vital is a brand-new one: Cumulative Layout Shift. This metric tries to determine how ‘stable’ stuff loads onto your screen. It looks at how often stuff jumps around while loading and by how much. You can imagine that sometimes a button loads on the screen, inviting users to click it. In the background, however, there’s still a large content area being loaded. The result? When the content finally fully loads, the button pushes down a bit — just as you want to hit that button. Again, frustration mounts!
These layout shifts happen a lot with ads. Ads are a lifeline for many sites, but these are often loaded so poorly that they frustrate users. Also, many complex sites have so much going on that these are heavy to load, and content gets loaded whenever it’s ready. This can also result in content or CTAs that jump around on the screen, making room for slower loading content.
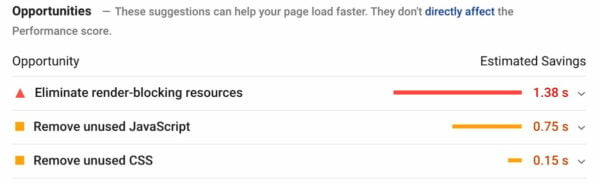
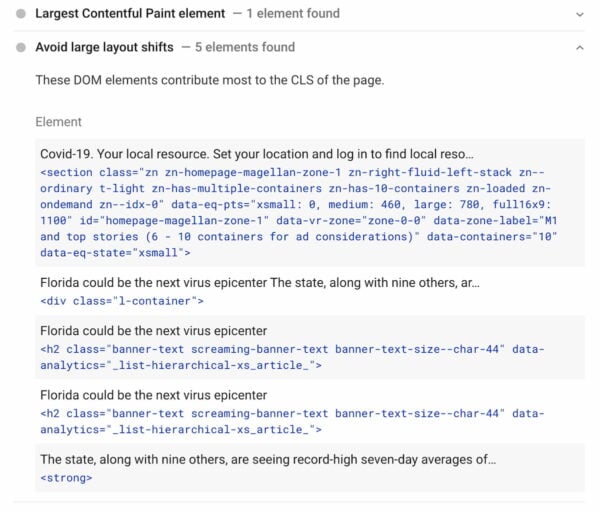
Take CNN.com, for instance. News websites are typically very complex and slow to load, and CNN is no exception. It scores really badly on a PageSpeed Insights test. If you look at the issues and the corresponding tips further down the page, you’ll notice that we found no less than five moving elements at the time of writing. When loading this page, it leads to many elements jumping around, and it takes a while for it to stabilize and be useful. And because users aren’t always that patient, they try to click a button when it appears on the screen — only to miss it because a big ad appears in that spot.
CNN.com doesn’t score too well in PageSpeed Insights. You can see it found five moving elements that contribute to the CLS
What you need to know
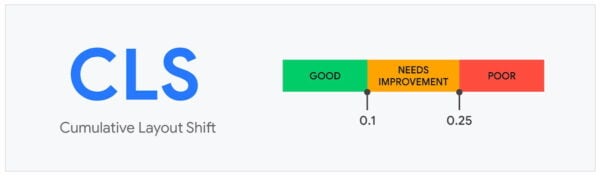
The Cumulative Layout Shift compares frames to determine the movement of elements. It takes all the points at which layout shifts happen and calculates the severity of those movements. Google considers anything below 0.1 good, while anything from 0.1 to 0.25 needs work. You can consider everything above 0.25 as poor.
The scores for CLS
Of course, the score only looks at unexpected shifts. If a user clicks the menu button and a fold-out menu appears, that doesn’t count as a layout shift. But if that button does call a big change in design, you should make sure to keep that clear for the user.
I’ve already mentioned that ads are one of the main culprits of this. They are often in JavaScript and not well-optimized, plus they are served from an external server. Slowness is added in every step, and you have to work hard to get your ads to appear in the right spot at a moment’s notice. But there’s another element that’s responsible for large layout shifts: images.
Developers don’t always specify the width and height of an image in the code and leaving it up to the browser to figure out how the image should appear on the screen. On a page with some images and text, the text will appear on the screen first, followed by the images. If the developer hasn’t reserved space for these images, the top part of the loading page will be filled with text, prompting them to start reading. The images, however, load later and appear in the spot where the text was first. This pushes the text down, getting the user agitated. So, always specify the width and height of the CSS images to reserve a spot for the images to load.
There are loads of tools to help you monitor Web Vitals and improve the performance of your site. I’ve mentioned a lot of them in the first Page experience post I wrote some time ago. You can see them listed there. Here, I’d like to highlight the most important ones:
PageSpeed Insights: PageSpeed Insights has turned into a full-service measuring tool with both field and lab data. Besides, you get advice on what to improve.
Lighthouse: Google built Lighthouse as a tool to audit PWAs, but now it’s a great tool to monitor performance. It has several audits that PageSpeed Insights doesn’t have, and it even has some SEO checks.
Search Console Core Web Vitals report: You can now get insights from your site straight from Search Console! Great to get a feel for how your site is performing.
Starting from June 2021, Google will update its algorithms to incorporate a new ranking factor: page experience. To measure page experience, Google developed a new set of metrics called the Web Vitals. You can find three core metrics within these Web Vitals: Largest Contentful Paint, First Input Delay, and Cumulative Layout Shift. These stand for performance, responsiveness, and visual stability — the three pillars of Google’s page experience update.
Keep focusing on your users and build an awesome site!
April 25 - 26, 2024
Team Yoast is at Attending, Speaking, Sponsoring Brighton SEO! Click through to see who will be there, what we will do, and more!
See where you can find us next »
24 April 2024
Learn how to start your SEO journey the right way with our free webinar. Get practical tips and answers to all your questions in the live Q&A!
All Yoast SEO webinars »
2 Responses to Learn about the three Core Web Vitals: LCP, FID & CLS
Dennis O'Brien • 3 years ago
Perhaps we’ll all go back to text only to satisfy Great God Google
Camille Cunningham • 3 years ago
Hi Dennis, I understand what you’re saying. We even have a fun article named stop pleasing Google including image that you might enjoy :) But of course, these core web vitals are also meant to offer visitors a good online experience while visiting your site. And that’s also what we believe: offering users the best experience possible. And eventually Google will reward you for that as well.


Perhaps we’ll all go back to text only to satisfy Great God Google
Hi Dennis, I understand what you’re saying. We even have a fun article named stop pleasing Google including image that you might enjoy :) But of course, these core web vitals are also meant to offer visitors a good online experience while visiting your site. And that’s also what we believe: offering users the best experience possible. And eventually Google will reward you for that as well.